We saw some selling last week with the S&P 500 off 2.7%, the Dow down 2.75% and now negative for the year, and Small Caps (ARCA:IWM) in the red by 2.57%. In last week’s Technical Market Outlook I showed a couple of charts that were showing a bias towards stocks heading lower, so I’m not overly surprised to see equities off a couple of percent. It was the worst week for stocks in two years, which I believe says more about the strength in stocks that’s taken place more so than the less than the recent 3% drop.
However, we did see some signs of capitulation on Thursday and Friday. Here are a few examples:
-The Volatility Index VIX, as measured by the ratio between VIX and VXV, entered backwardation.
-The Equity Put/Call Ratio hit its highest level in two years.
-The ratio between Declining Volume and Advancing Volume on the NYSE was over 9:1.
-The percentage of stocks over their respective 50-day Moving Average for the S&P 500, Dow, Nasdaq, and NYSE were near or under 30%.
-The -DI of the ADX indicator broke above 40, which has previously occurred at short-term lows in equities.
So have we seen an end to the selling? I don’t know (and neither does anyone else) but it does appear we may be short-term oversold and see a bounce. As we enter trading for August, which has historically not been a strong month for equities (we’ll get into that later) it’s possible we see bears continue to take things lower, especially if the geopolitical tensions in Ukraine/Russia heat up.
Trend
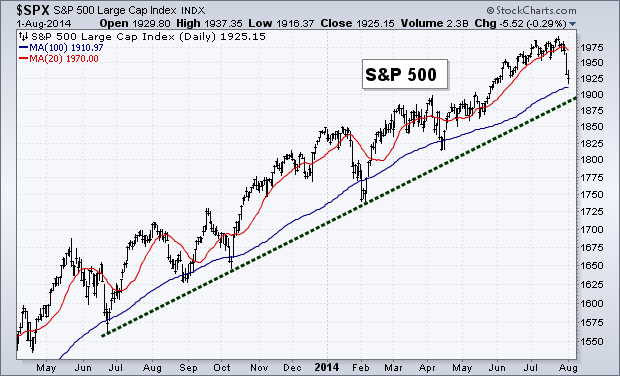
While we broke through the short-term trend line (not shown) the S&P 500 remains above its long-term trend line, and we have yet to see a break in the series of higher highs and higher lows. While we saw a bit of selling last week, the trend in the U.S. stock market is still positive.
Breadth
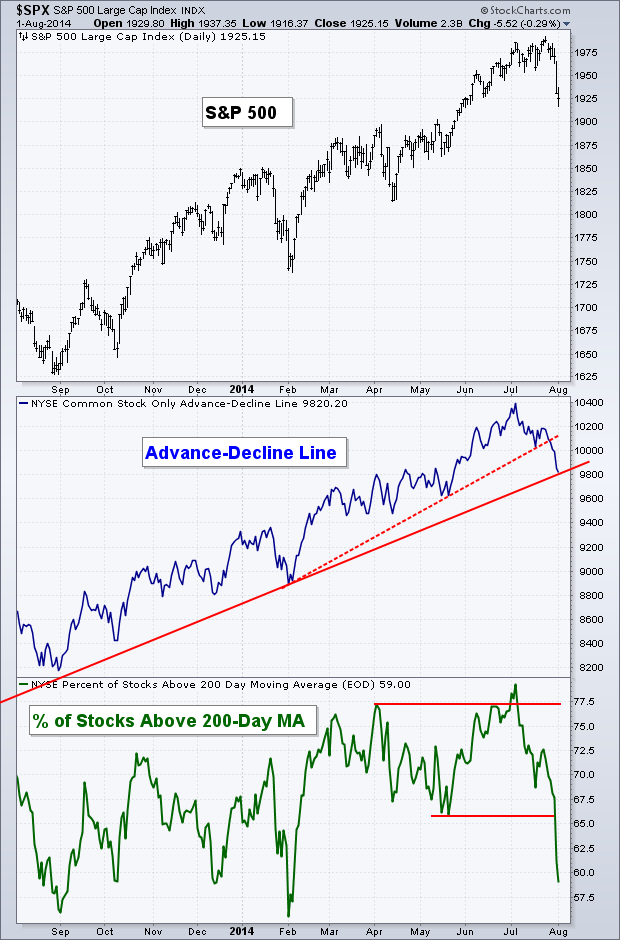
Like the break in the short-term trend line for price, we also saw a break in the short-term trend line for the Advance-Decline Line. While this breadth indicator created a small divergence with price going into last week’s sell-off, it now sits at support. Less than 60% of stocks on the NYSE are now above their respective 200-day Moving Averages with the up trend broken on the breadth indicator in the second panel of the chart below.
If selling continues this week then we’ll likely see an end to the up trend in the Advance-Decline Line as it follows price lower. How long this potential down trend lasts will be important in helping diagnosis the health of the stock market.
Equity Seasonality
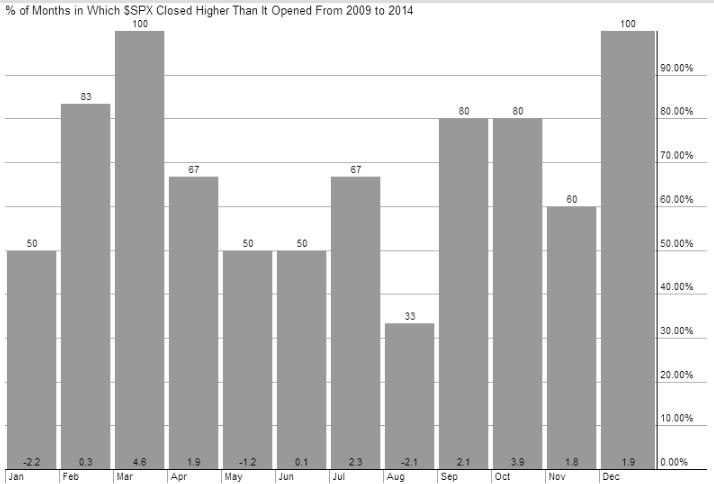
As I mentioned earlier, August has not been kind to the S&P 500 (SPY) during the current bull market. The below chart shows the percentage of each month that it’s closed higher since 2009. As you can see, August has been the weakest month, being positive just 33% of the time. Meanwhile, since 2010 the VIX has seen August as it’s best month, having been up 75% of time. If we can get past August, the last four months of the year have all been north of 60% positive.
Momentum
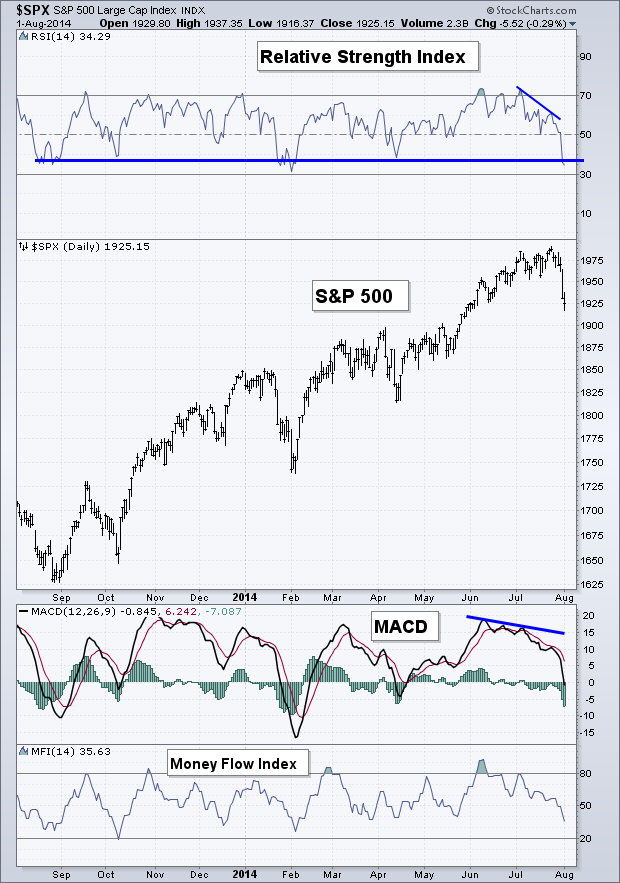
After the negative divergence that helped send up a warning flag going into last week, we now have the Relative Strength Index (RSI) testing its bullish range support level. I’m watching to see if the RSI bounces here or if it’s able to get under 30 and become ‘oversold’. Bulls would prefer to see support held and the bullish channel maintained, but the bearish divergence of lower highs two weeks ago might have been some foreshadowing into a potential shift from a bullish range to a bearish range for momentum. We’ll see.
Andrew’s Pitchfork
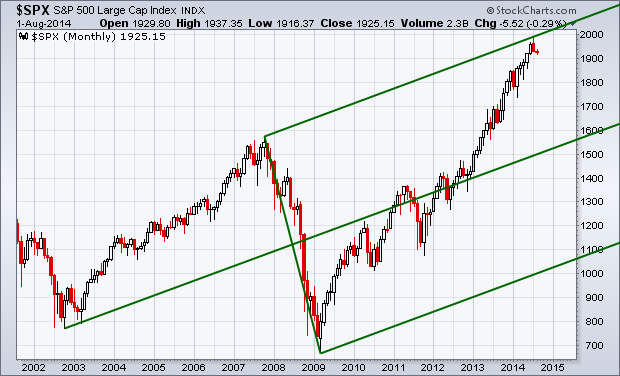
I tweeted out this chart on July 28 as possible resistance for the S&P but I wanted to show it here for those of you didn’t see the tweet. Below is a monthly chart of the S&P 500 going back to 2002. While I did not invent the Andrew’s Pitchfork (was developed by Alan Andrews I believe in the 1970′s) and name it after myself, this indicator helps show potential levels of support and resistance.
When using the price low in 2002, the high in 2007 and the follow low in 2009, the Pitchfork on the chart below is created. As you can see on the chart, in July we hit the upper trend line and have since bounced lower. This is the chart I’ll be watching if we do see price recovery and make a run at a new high. This resistance needs to be addressed if the bulls are to remain in control.
Health Care Sector
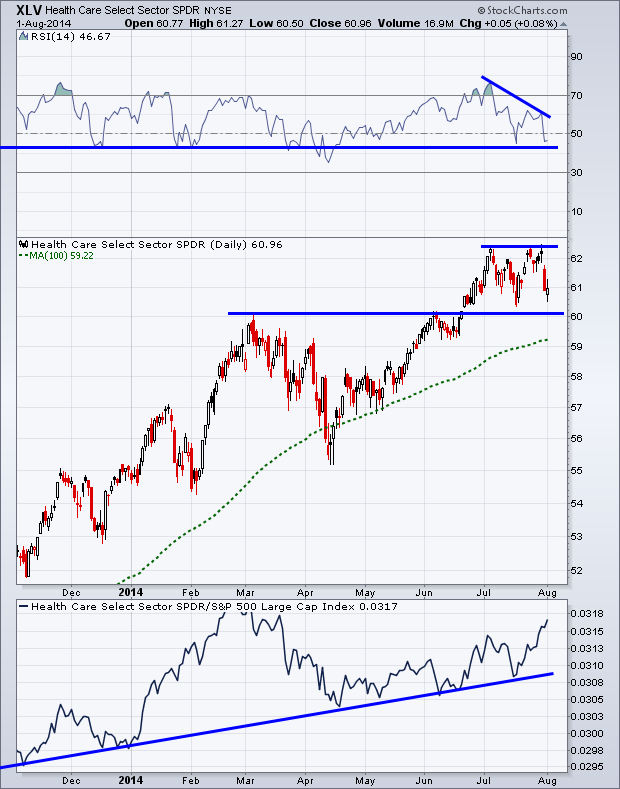
Based on the data collected by the Stock Trader’s Almanac, August starts a historically bullish period of time for the Health Care sector (XLV), so I thought it would be nice to take a look at a chart of the Health Care Select Sector SPDR ETF (XLV). Health Care has been one of the stronger sectors for 2014, after being a strong out-performer in 2013.
Most recently, like the S&P 500, a negative divergence in momentum developed as $XLV attempted to make a new high. The RSI indicator is now just above its support level which was created during previous declines in 2013 and 2014. Price is also above its potential support of the prior high in March and June as well as the 100-day Moving Average. With seasonality showing a bullish bias for health care and the current strong relative performance, it’s likely we see $XLV hold above support and continue its current up trend.
Last Week’s Sector Performance
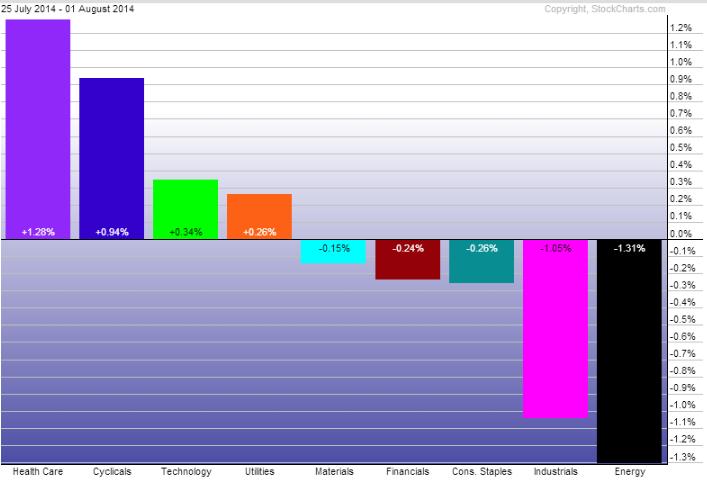
Health Care (ARCA:XLV) was the strongest sector last week, followed by Consumer Discretionary (ARCA:XLY) and Technology (NYSE:XLK). Energy (ARCA:XLE), Industrials (Industrial Sector SPDR Trust (ARCA:XLI) and Consumer Staples (ARCA:XLP) were the weakest performing sectors for the week.
Year-to-Date Sector Performance
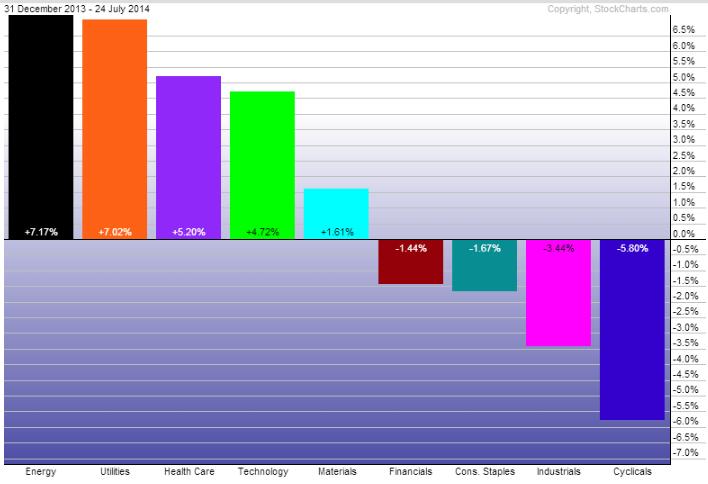
Even though it was the worst performing sector last week, Energy is the best performing sector so far in 2014 followed by Utilities (NYSE:XLU) and Health Care.
Disclaimer: Do not construe anything written in this post or this blog in its entirety as a recommendation, research, or an offer to buy or sell any securities. Everything in this post is meant for educational and entertainment purposes only. I or my affiliates may hold positions in securities mentioned in the blog. Please see my Disclosure page for full disclaimer.
