Welcome back, I hope everyone had a great weekend. I started my BBQ competition season this past weekend in Mt. Carmel, IL. There were some of the best teams in the country present and we had a lot of fun and finished up 19th out of 50 teams. We closed out last week with four sectors now under their 50-day Moving Averages lead by the selling on Friday. Crude ended the week lower after testing the resistance I mentioned in my Technical Market Outlook post two weeks ago and is now testing the rising trend line off the 2014 lows. Emerging markets (ARCA:EEM) have continued to under perform
Equity Trend
While this portion of the Technical Market Update has previously been fairly uneventful we are starting to see the development of a potential trend change. With Friday’s sell-off we may have begun to see the start of a lower low. The selling also happened at the March high which may signal that the pop to a fresh new all-time high in April was more out of exhaustion than resound bullishness. As always, we allow the price to lead the way and would still need to see a break of the April low, as well as the rising trend line that developed during 2013, before the bears takeover the trend. 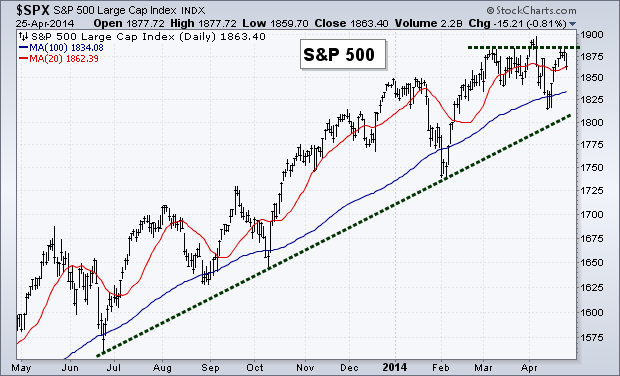
Equity Breadth
We still have a bullish setup in breadth with the Advance-Decline just coming off a fresh high. The percentage of stocks above their 200-day MA is also in a short-term rising up trend, which is currently close to be testing. 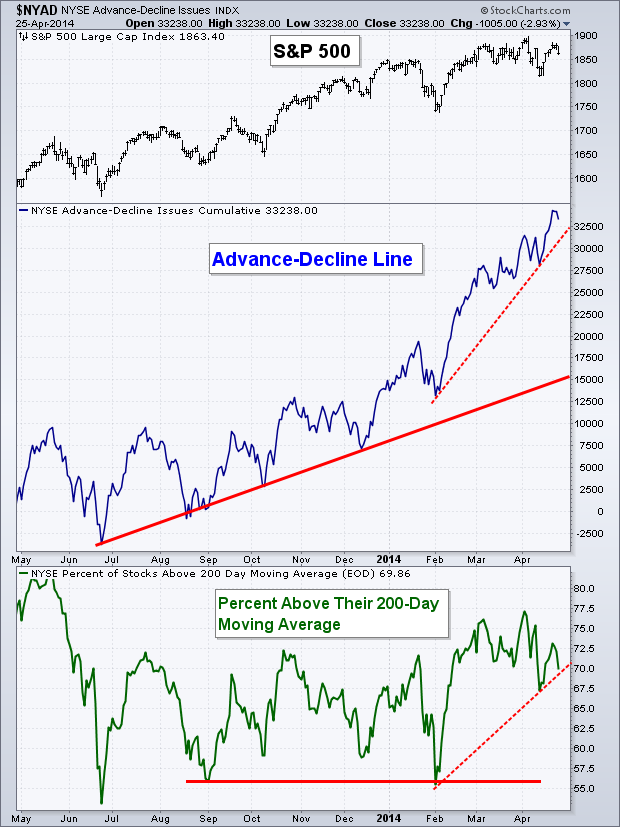
Equity Momentum
As I have been saying for the last couple of weeks, momentum is one of the uglier charts for equities. While two weeks ago we saw the Relative Strength Index (RSI) hold support as stocks began to rise, a negative divergence is still taking place. The RSI has been making lower lows for the last four months. The same type of divergence is beginning to develop on the weekly chart as well. While the S&P 500 (SPX) got back to its March high the MACD is barely positive. As we enter the historically bearish 6-months of the year it may be hard for the equity market to buck bearish momentum AND bearish seasonality. 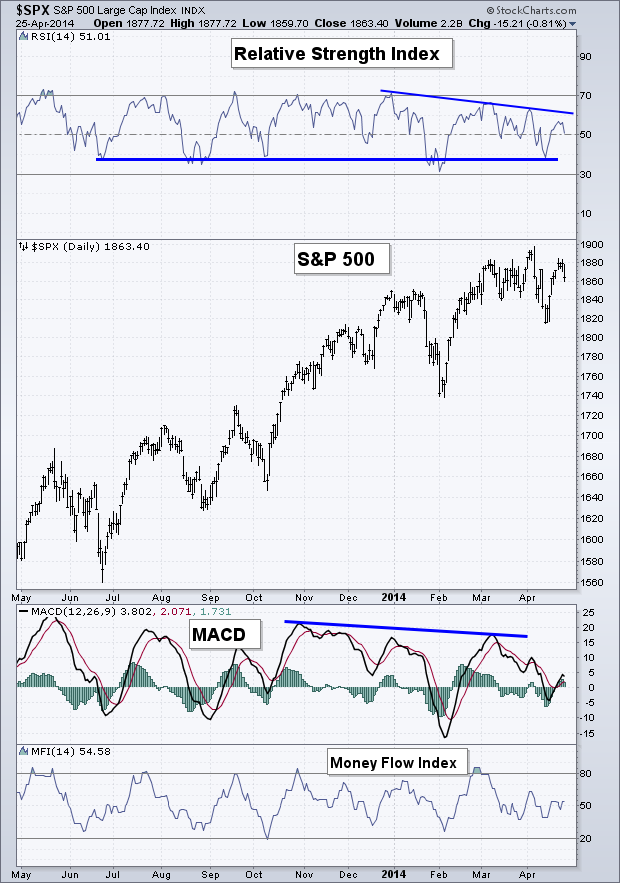
Coffee
As I noted last week in my brief Technical Market Outlook, I’m keeping a close eye on commodities. I came into this year one of the few bulls for the agriculture space but as all things – once they go up they must come back down. One of the best ag commodities this year has been coffee, up 87%. Since it’s one of the leaders I’m watching it for early signs of deterioration in its trend. Last week we saw coffee (KC_F) prices break above their March high but to only give those gains partially back on Friday as it fell back under the previous high. This took place with the Relative Strength Index creating a negative divergence of lower highs. Although, price is still in it’s up trend off the previous April lows. If we see a break of 2.00 and the RSI breaks under 50 then we may begin to start seeking lower prices. 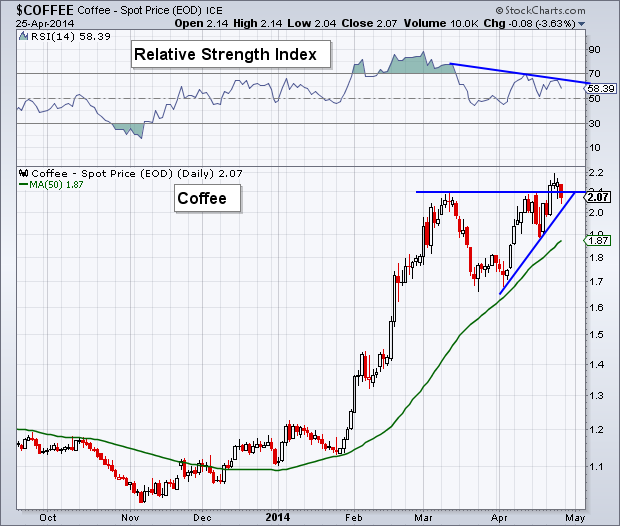
If we look at the 5-year seasonal trend for coffee we can see that historically a peak has been put in at the start of May. The same type of pattern also occurs on the 10-year and 15-year look back periods as well. 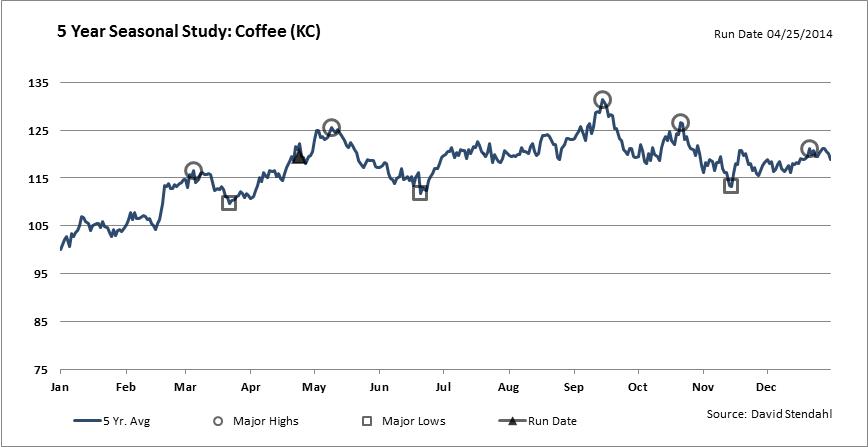
60-Minute S&P 500
The one hour chart of the S&P 500 (SPX) does a nice job showing the resistance created by the previous March high. The RSI and MACD both have rolled over and bears will be attempting to set their sights on the April low around 1815 as the next target. If we do not see continued selling then bulls need to get to 1900 to keep things in their control. 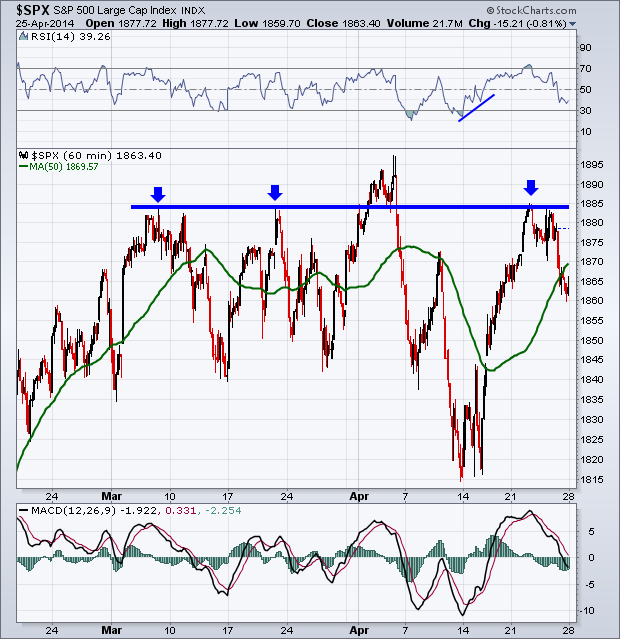
Sentiment
I always find it interesting to see what the retail investor is doing. While most of the attention seems to get focused on the polls by AAII, Investor Intelligence, and NAAIM, they don’t actually show you what investors are doing. However, the data provided by Rydex funds does. Below is a chart of the total assets held in the bullish funds by Rydex divided by all Rydex assets combined. While the S&P was unable to make a new high, the percentage of assets held in bullish funds did. Retail investors still like stocks and are continuing to push money into the market. 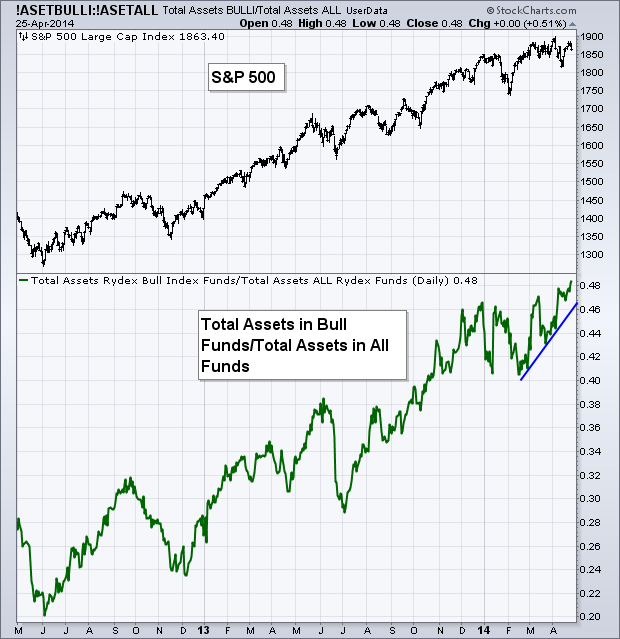
Last Week’s Sector Performance Utilities (XLU) continued to lead on a relative-performance basis as the strongest sector. With health care (ARCA:XLV) and energy (ARCA:XLE) also seeing strength. Technology (XLK) and materials (ARCA:XLB) were the weakest performers during trading last week. 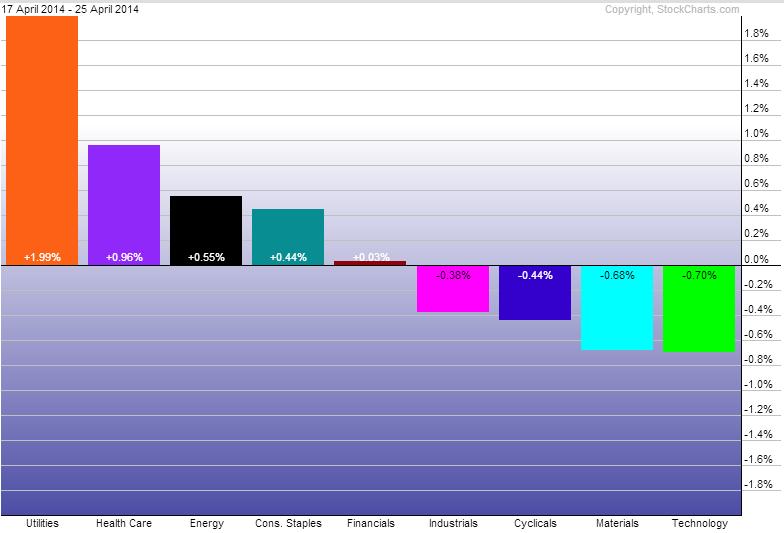
Year-to-Date Sector Performance
With the increase in performance from energy (ARCA:XLE) and the continued dominance of utilities (XLU) I’ve begun seeing people reference the sector rotation chart created by John Murphy over at Stockcharts.com. Murphy shows that historically the strongest sectors at market highs have been materials, energy, staples, and health care, with utilities not far behind. And as you can see, a large chunk of those sectors are what’s been leading in 2014. Utilities continue to lead YTD with energy pushing past health care for the number two spot. 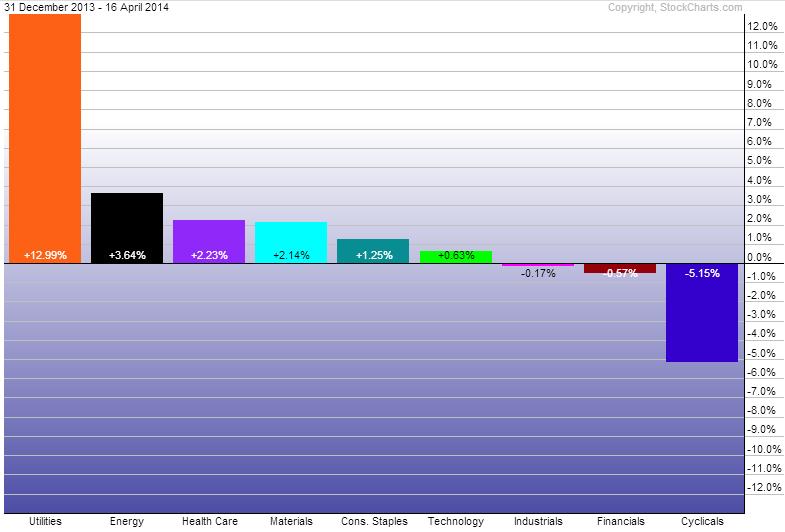
Major Events This Week
We have a fairly busy week this week as it pertains to economic reports. The main focus will likely be on Wednesday with the GDP data and the FOMC Announcement. Now that Yellen has told us she doesn’t think unemployment is as important as it was to her predecessor, traders are able to breath a little easier (hopefully) on Friday.
