
 AUD/USD Daily Chart" title="AUD/USD Daily Chart" width="604" height="364">
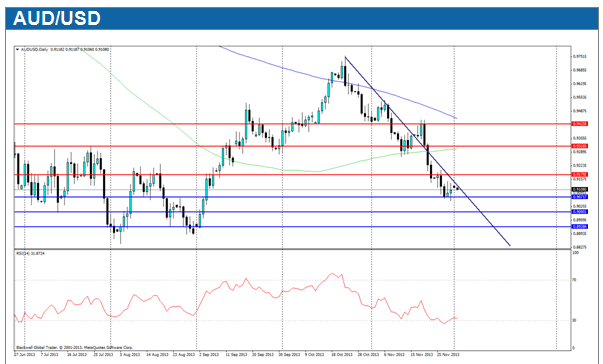
The Aussie dollar fell over the past week,as strong US data and talk of FED tapering helped push down the Australian dollar. This decline was also further accentuated by the Reserve Bank of Australia as they look to talk down the Australian dollar in an effort to help the export sector and help boost the ailing economy.
This week will be busy in the early stages, especially as retail sales data is due out, which will help paint a solid picture of the Australian economy. In the same day, we will also have the interest rate statement from the RBA, which is unlikely to move current rates given its recent cut and more than likely, we will see further talking down of the currency.
Current resistance levels can be found at 0.9179, 0.9318 and 0.9425 as the pair has crashed through major levels as of late and the only clear resistance points are spread out. While Support levels can be found at 0.9071, 0.9000 and 0.8928 – we expect the 0.90 mark to act as a hard floor and may require substantial pressure to break through.
EUR/USD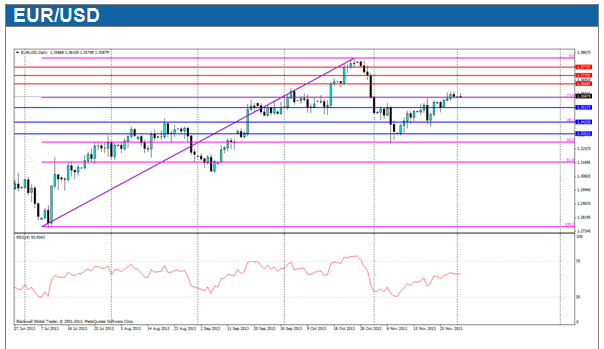 EUR/USD Daily Chart" title="EUR/USD Daily Chart" width="604" height="364">
The euro clawed its way higher against the USD last week, as Economic Confidence as well as Industrial Confidence lifted well above current economic forecasts. CPI data also showed a slight increase, while the unemployment rate also showed a slight decrease which boded well with the ECB as it looks to improve the economy.
Markets will be focusing on the Manufacturing PMI for the major economic zones of the euro-zone this Monday, before Tuesday’s big announcements of GDP data and Retail Sales with GDP expected to fall, while Retail Sales are expected to lift slightly – aiding further to the economic recovery outlook.
Current technical movements show that the EUR/USD is looking slightly bullish after last week’s market movements, with resistance levels found at 1.3668, 1.3720 and 1.3772 respectively. Additionally support levels can be found at 1.3517, 1.3425 (38.2 Fib mark) and 1.3351, with the major support level found at 1.3517.Despite the recent upturn in the EUR/USD pair, there are still dangers from the ECB talking down the currency in the short term this week.
GBP/USD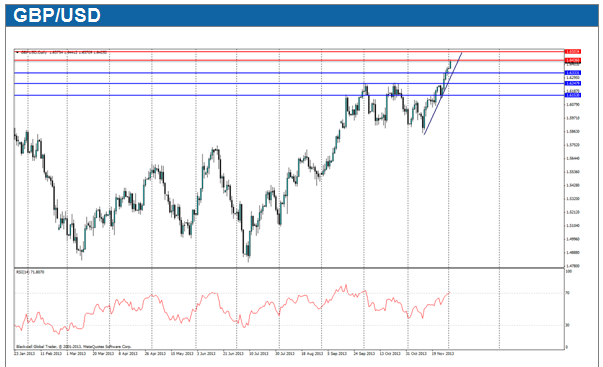 GBP/USD Daily Chart" title="GBP/USD Daily Chart" width="604" height="364">
The pound surprised markets last week and rose strongly against all major trading partners to hit highs not seen since 2011. Markets were buoyed by governor Mark Carney’s comments that the pound is recovering, and that stimulus would be tapered in-line with the US, so as not to cause any economic shocks to the currency.
The markets will be watching with bated breath this week at Mark Carney’s monetary policy report due out with the interest rate announcement on the outcome of the pound – as well as additional talk on the stimulus program in the UK, which is expected to remain the same for the time being.
Market technicals show that the bullish trend line for the pound is very steep and strong, with resistance levels at 1.6436 and 1.6500 as the pound searches out new highs. Support levels can be found at 1.6333,1.6247 and 1.6153 with major support at 16331. However, it looks unlikely to be tested in the near term as the pound's strength has pushed through the 70 RSI mark without letting up so far.
NZD/USD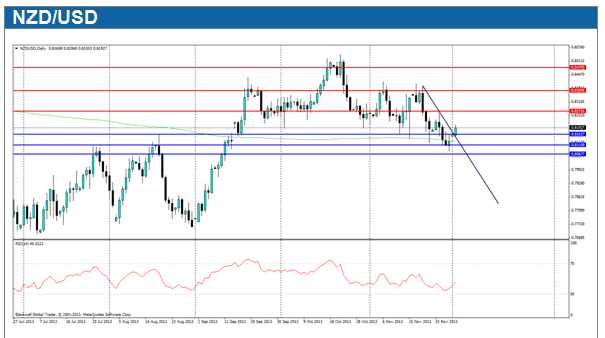 NZD/USD Daily Chart" title="NZD/USD Daily Chart" width="604" height="364">
The New Zealand dollar fell over the last week as the Australian economy dragged further on the Kiwi dollar, despite a better trade balance result, and as business confidence lifted heavily in the economy. The Kiwi dollar has been overvalued as of late and any downfall is expected to be slow rather than rapid.
Traders in the coming week will be short handed when it comes to major NZ data, however Australian data is expected to be heavy, and the RBA will look to talk down the currency further in the short term as it looks for an export-led recovery which in turn could drag on the Kiwi.
Market technicals show that resistance can be found at 0.8271, 0.8369 and 0.8479, while support levels can be found at 0.8161, 0.8110 and 0.8067 with major support at 0.8110. The RSI shows the pair breaking through the current bearish downtrend. However, this would need to be supported by markets closing to signal a breakout and back to the pair ranging.
USD/JPY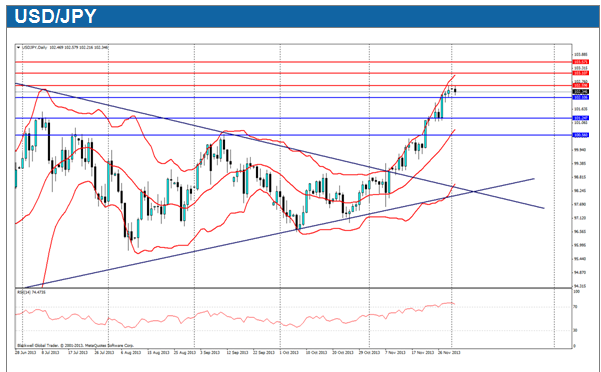 USD/JPY Daily Chart" title="USD/JPY Daily Chart" width="604" height="364">
The yen’s depreciation against the USD was aggressive last week, as new data showed that inflation was indeed occurring at 0.9% for the month,in line with forecasts and further supporting Abeonomics as a major contributor to the economic recovery of Japan. Additionally, the unemployment rate lifted to 4%, however this is seen as healthy and not ofconcern for the economy.
This week though is set to be weak for economic news compared to last week’s mass announcements, and the focus will most likely be on US data which plays a big part moving the pair, as Nonfarm payroll as well as housing data will certainly move the pair heavily.
Looking at market technical, we can see that current resistance is at 102.598, 103.107 and 106.575 with strong resistance found at 103.107. Current support levels can be found at 102.106, 101.247 and 100.560. The current market sentiment is bullish, however the RSI shows over-extension and a consolidation could be in the works before any further push.
DISCLAIMER: The report provided by Blackwell Global Investments Limited ("Blackwell Global") is meant for informative reading and should not be relied upon as a substitute for extensive independent research . The information and opinions presented do not take into account any particular individual's investment objectives, financial situation, or needs, and hence does not constitute as an advice or a recommendation with respect to any investment product. All investors should seek advice from certified financial advisors based on their unique situation before making any investment decisions and should tailor the trade size and leverage of their trading to their personal risk appetite.
Blackwell Global and all of its subsidiaries and affiliates endeavour to ensure that the information provided in this communication is complete and correct but make no representation as to the accuracy or completeness of the information. Information, data and opinions may change without notice and Blackwell Global is not obliged to update on the changes. The opinions and views expressed in the report are solely those of the authors and analysts and do not necessarily represent that of Blackwell Global. It should not be construed as financial advice for a purchase or sale of any foreign currency, contracts-for-differences, precious metals or any other products offered by Blackwell Global mentioned herein. Any projections or views of the market provided by Blackwell Global may not prove to be accurate. Past performance is not necessarily an indicative of future performance. Blackwell Global will not accept liability for any losses incurred directly or indirectly made by readers and clients as a result of any person or group of persons acting on the information contained herein.
The Blackwell Global's Research team does not render investment, legal, accounting, tax, or other professional advice. If investment, legal, tax, or other expert assistance is required, the services of a competent professional should be sought. This report is prepared for the use of Blackwell Global's clients and may not be reproduced, distributed or published by any person for any purpose without the prior consent of Blackwell Global.