Summary: US equity markets made new all-time highs again this past week. By Friday, SPX had risen 7 days in a row; that type of trend persistence has a strong tendency to carry the markets higher over the next week(s). While a period of higher volatility than what has been seen so far this year is odds-on, investors should not expect the bull market to be near an important top. Markets weaken before they reverse, and the existing trend has yet to weaken at all.
That said, the month of June is seasonally weak and there are a number of reasons to suspect it will be again this year, not the least of which is the FOMC meeting mid-month during which markets anticipate the Federal funds rate will be hiked for a 4th time. The prior three rate hikes have coincided with notable drawdowns in equities (as well as a fall in treasury yields).
SPX, NDX and COMPQ all made new all-time highs (ATH) again this past week. Including dividends, the DJIA also made a new ATH for the first time since March 1. The primary trend remains higher.
The new highs for the US indices were accompanied by ATHs in several large sectors: technology, industrials, utilities and staples. The consumer discretionary sector had its highest ever weekly close. The healthcare sector is within 0.5% of its March high. Likewise, the very broad NYSE is just 0.2% from a new ATH. With six sectors and the NYSE at or near new ATHs, it's hard to say that healthy breadth is lacking.
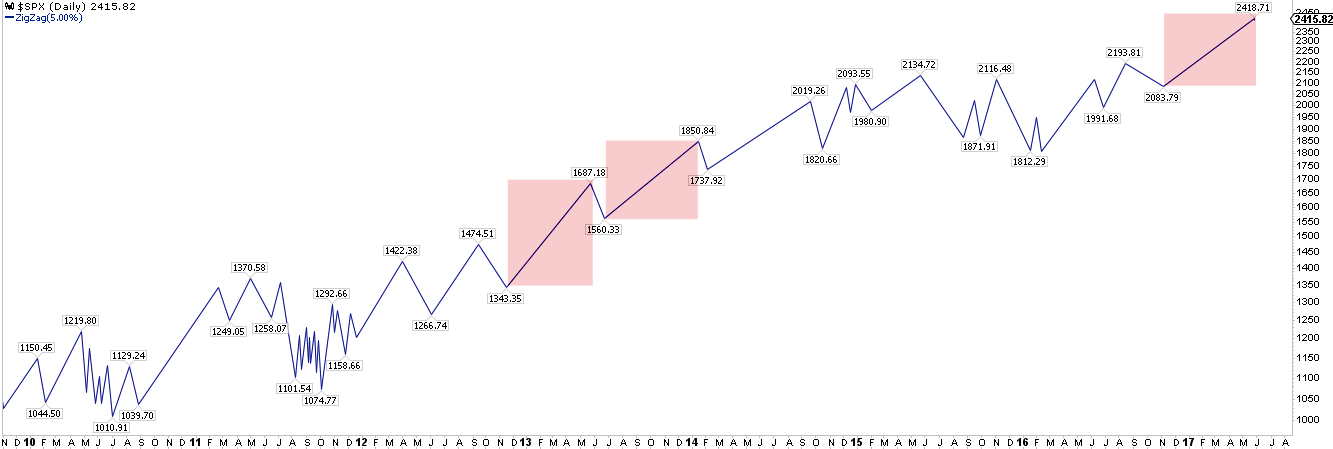
Notably, SPX has now risen 7 days in a row. In the past 5 years, this has occurred only five other times, four of which were during the 2013 boom. In all five instances, SPX closed higher again within the next 5 days by a median of 0.7%. By Day 5, SPX was higher 4 of the 5 times.
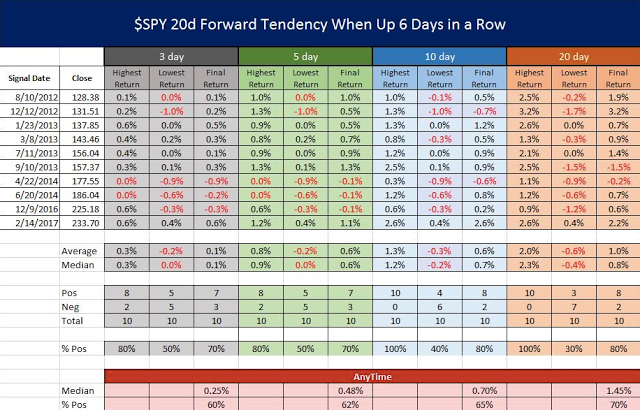
For a larger sample size, consider the strong performance after SPX has risen 6 days in a row. SPX closed higher either 10 or 20 days later in 9 of 10 instances since 2012. Risk/reward (defined as max gain versus max loss) during the next 10 days and the next 20 days was 6 times higher. Clearly, trend persistence overwhelmingly led to further gains and favorable risk/reward (table from Twillo using data from indexindicators.com).
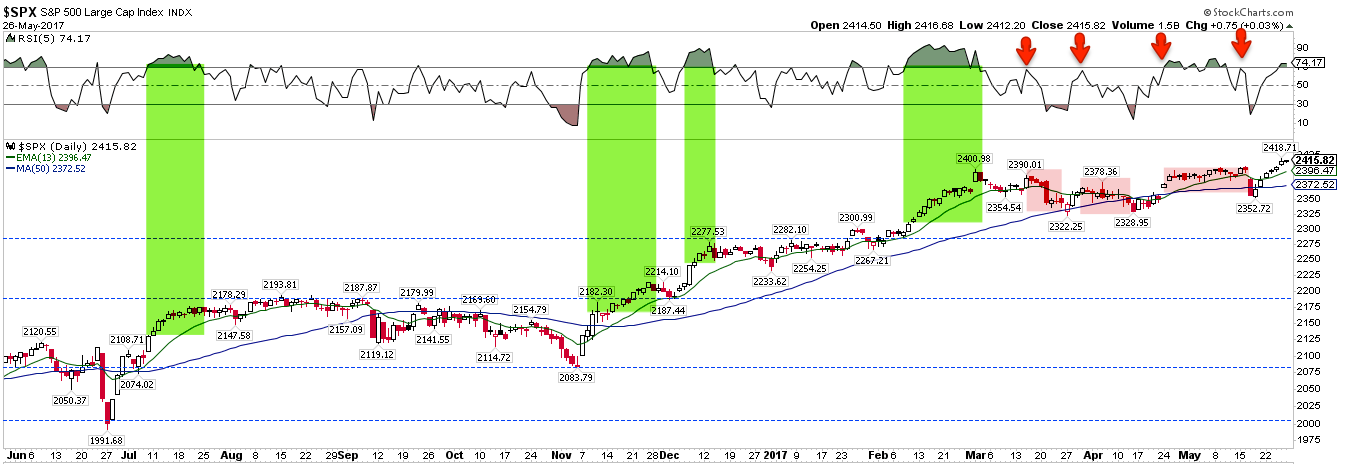
SPX is, nonetheless, at a point where further gains have been limited. RSI(5) reached "overbought" on Thursday (top panel). Strongly trending market environments are partly defined by their ability to remain overbought (green shading), yet since the SOTU on March 1, this has been precisely when SPX's upward momentum has failed (arrows; red shading).
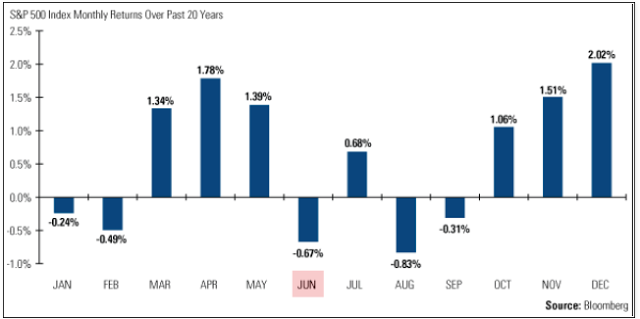
Seasonality, which can be fickle, is no longer a tailwind for equities. June, in fact, tends to initiate summer seasonal weakness (from Bloomberg).
A few factors make June a likely month for weakness in US equities this year as well.
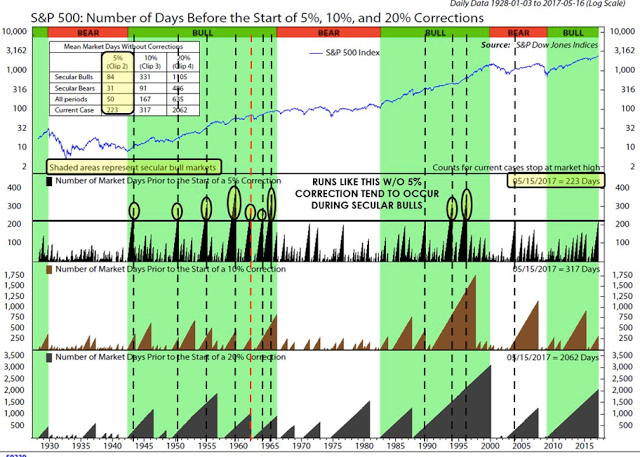
First, as we have mentioned previously, SPX has now avoided a 5% drawdown since November 4, a period of 139 days. Since 2009, there have been only two uninterrupted uptrends that have lasted longer: 142 days (ending January 2014) and 158 days (ending September 2014). If past is prologue, then SPX appears likely to have a 5% correction before June 23 (158 days).
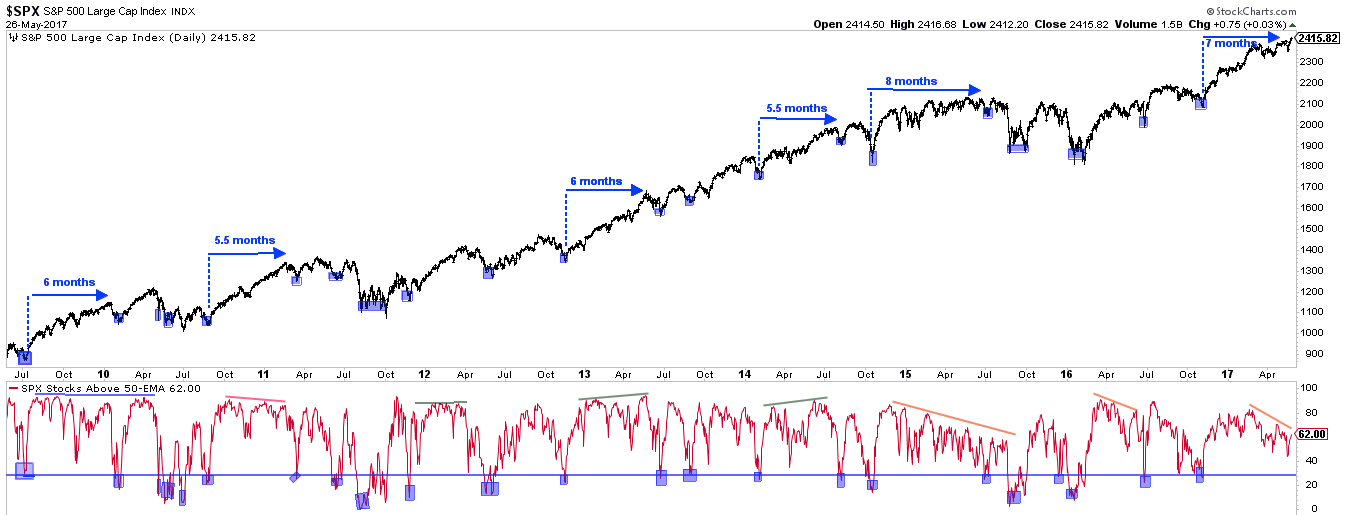
Similarly, markets have a tendency to periodically "washout." One way that can be measured is by the percentage of stocks trading over their 50-dma; a washout would coincide with a reading under 30% (lower panel). It has now been 7 months since the last washout.
These streaks have extended to 8 months only twice since 2004 - in February 2007 and June 2015, leading to declines in SPX of 7% and 12%, respectively. Even the powerful 2013-14 run did not go more than 6 months without a washout in breadth.
Third, sentiment is, on balance, getting hot. Evidence is contradictory: survey data from Investors Intelligence and NAAIM are overly bullish, while AAII is not. Moreover, equity fund flows have been negative the past four weeks in a row, during which time the indices have risen. This is hardly a sign of excessive bullishness among investors.
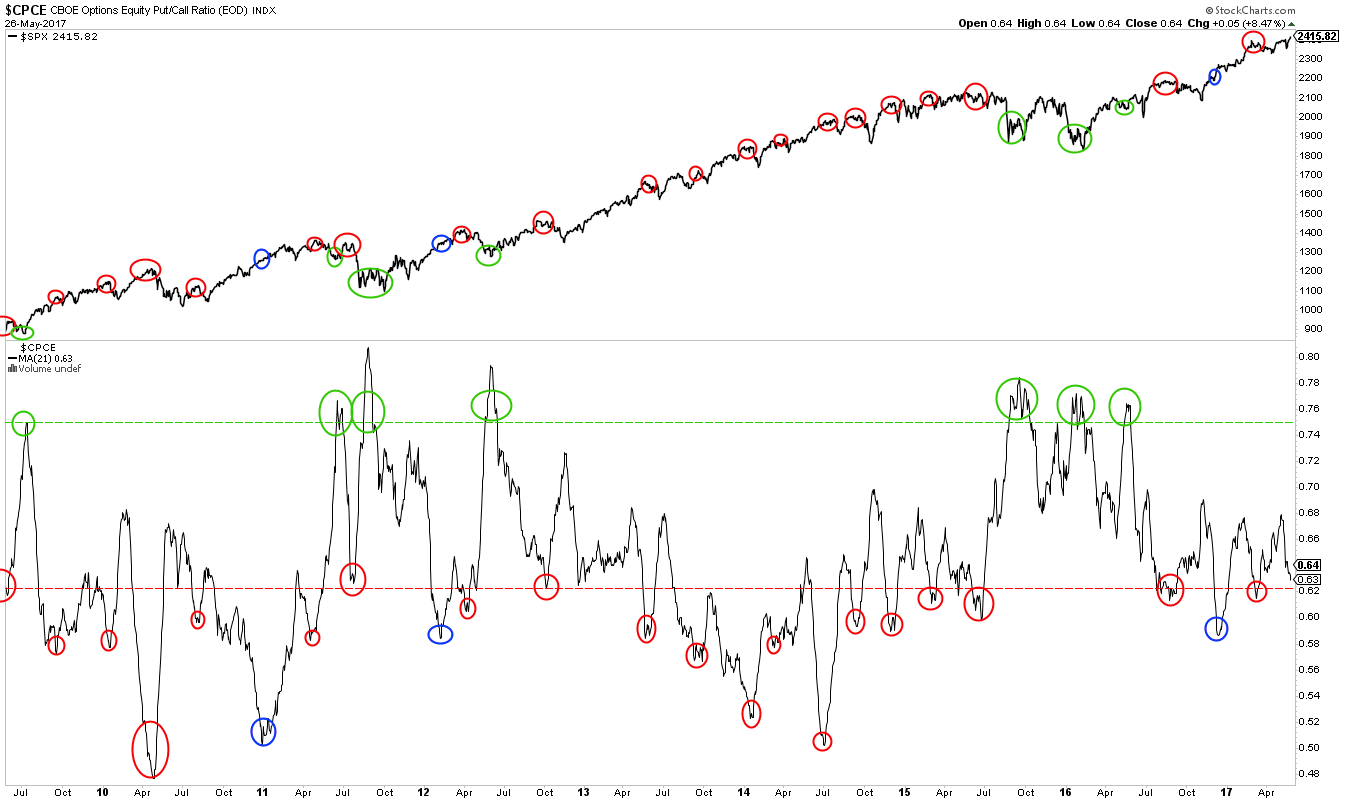
But options data is now leaning towards a bullish extreme. The one-month average for the equities-only put/call ratio is at a 2-month low, corresponding to the start of a 3% drawdown that ended in mid-April. Prior examples are circled. A further rise in equities in the next week - accompanied by a further fall in the put/call ratio - would push this measure to where a drop of 3-5% in SPX becomes very likely.
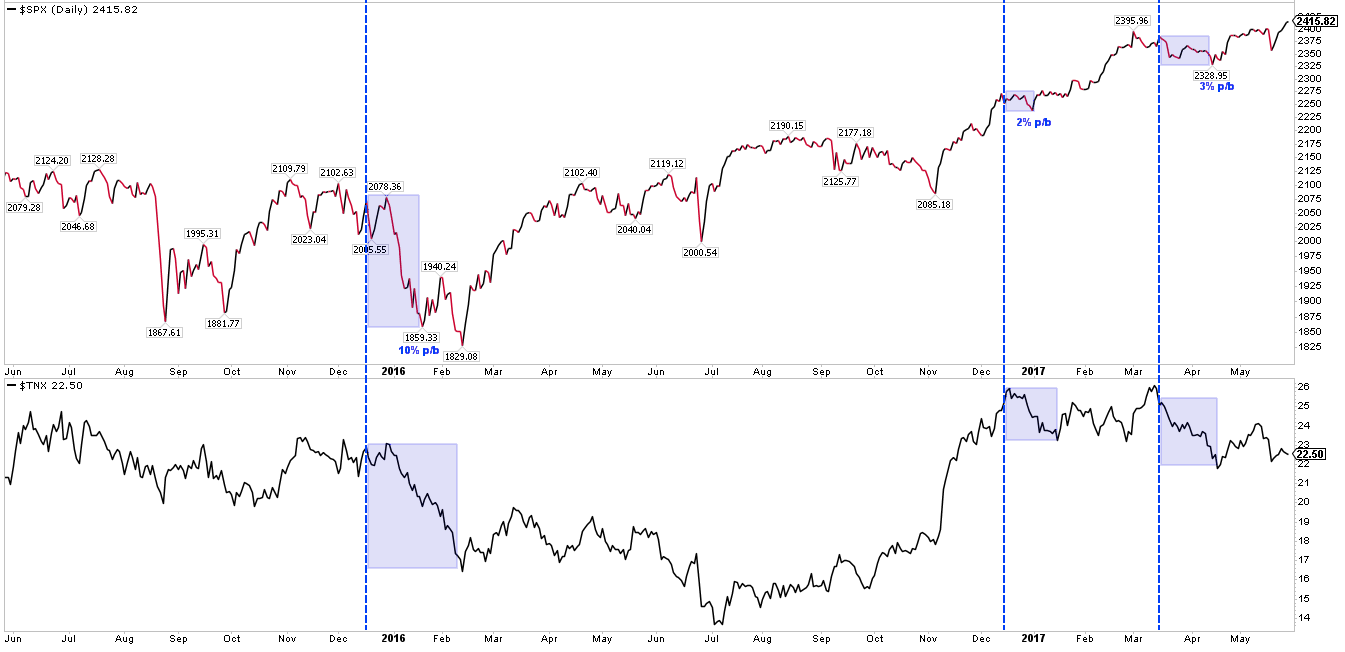
Finally, markets now expect the FOMC to enact a 4th rate hike in June. The FOMC has its policy meeting on June 14. It's a small sample but nevertheless notable that US equities have dropped in the month after the three prior rate hikes (sometimes beginning before the FOMC meeting date). Treasury yields (lower panel) have also fallen.
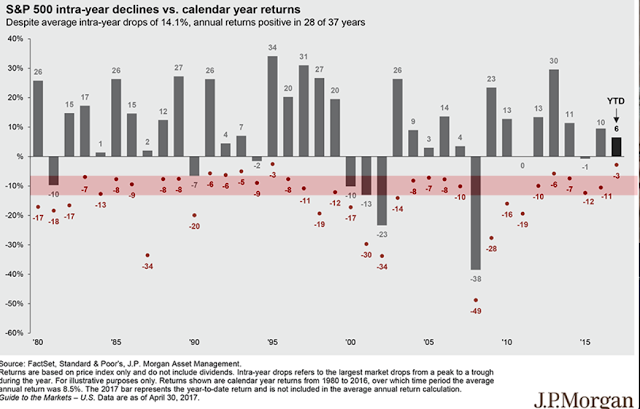
So, while the trend in equities is unambiguously higher, there are several watch-outs in place as we enter June. This should not be a surprise. Equity markets undulate higher during bull markets, with a median annual drawdown intra-year of about 10%. SPX gained more than 30% in 2013, but also fell 3-8% at six different points during the year, usually every other month (from JP Morgan).
While a period of higher volatility than what has been seen so far this year is odds-on, investors should not expect the bull market to be near an important top. Markets weaken before they reverse, and the existing trend has yet to weaken at all. There have been 11 streaks without a 5% correction as long or longer than the current one since the 1930s, and in only one of these has a bear market immediately followed (from NDR).
As the third chart in this post shows, June tends to be seasonally weak. But weakness in June also tends to set up a summer rally in July.
On the calendar for this week: Monday is a holiday, PCE is released Tuesday, auto sales on Thursday and NFP employment on Friday.
