
- All Instrument Types
- Indices
- Equities
- ETFs
- Funds
- Commodities
- Currencies
- Crypto
- Bonds
- Certificates
Please try another search

Week Ahead: Stocks Hit Record Highs Amid Reflation Reversal; Q1 Earnings On Tap

- Earnings season begins with banks reporting mid-week
- Cyclical rotation seesaw at work as gains keep shifting between growth and value
- It's a take-profit correction. But that suggests that the market will rotate back into value, and
- The Fed’s continuous insistence that inflation is not an issue. However, if that's the true motive behind the moves, there's no expectation that another reversal will occur in the foreseeable future.
Ahead of the start of Q1 2021 earnings season, which begins on Wednesday, Apr. 14, when the big US banks report, Wall Street indices added another string of records on Friday. The S&P 500 and Dow Jones Industrial Average hit new highs to close out the week. The NASDAQ and Russell 2000 closed higher as well, though neither notched new records.
According to the current market narrative, these gains indicate that investors are shrugging off inflationary concerns to focus instead on the expanding prospects of an economic rebound. We, however, believe there's another pattern at work here, one that suggests there's a different trend unfolding.
New Market Trend Playing Out
Some of last week's biggest market winners were the mega cap technology giants, which have recently been lagging while energy shares surged. Indeed, tech and energy have been the two most obvious, oppositional sectors, consistently performing in mirror image to each other to create what is sometimes referred to as a cyclical rotation.
Energy—a reflationary sector—skyrocketed 56.5% in the last six months, beating all other sectors and strongly outperforming tech shares, which had earlier benefited the most from the pandemic. Yet, during the same period, while energy stocks were accelerating, tech shares gained only 18%, a more than 3:1 ratio. Energy stocks also outperformed during the last three months, gaining 16.3%, but less than 2:1 compared to tech stocks which rallied 8.4%.
Over the past month though, investor priorities appear to have flipped. In the most recent period, energy was the only sector in the red, falling 7.5%, while technology stocks jumped 9%, outperforming the remaining ten S&P 500 sectors.
And, once again during the past week, energy was the only sector in the red, falling 4.2% into negative territory, while technology provided the best returns, rising 4.7%.
Finally, on Friday, although not the only sector in the red, energy still was the laggard, dropping 0.7%, while tech shares were among the outperformers, gaining 1%.
Lest you think energy is influenced by more than the fate of the economic recovery, for example, because of anomalies in storage and production following lockdowns, as well as green energy initiatives, we're seeing the same negative correlation between the financials—whose fate is directly related to interest rates, which rise and fall according to economic growth—and tech shares, albeit in less drastic fashion.
Over the last six months, financial stocks were the second-best performers as a group, after energy, gaining 39.3%—more than double of technology’s 18%. In a three-month view, Financials still provided superior returns, with a 13.7% advance but, only 61% percent better than tech’s 8.4% in the same period.
However, during the last month, the two reversed, during the same time the flip with energy occurred; financials gained just 3.9%, while tech, comparatively, nearly tripled, rising 9%. And again, in the last week, financial shares added 2%. That was less than half of tech’s 4.6% advance.
Finally, on Friday, financials gained 0.9% to tech’s 1% climb. That's another sector displaying the same paradigm shift activity over the same period, yet it's not affected by oil market considerations.
Irrespective of the ongoing cyclical rotation between value-led shares (energy and financials) and growth-led gains (technology) the broader S&P 500 Index still posted its third weekly advance in a row—its longest winning streak since October.
In the same time, however, there was a less visible (to some) concerning indicator—volume on the US exchanges reached a new low for 2021. This is a negative divergence, between rising, record prices in some cases, even as participation drops.
On Friday, the Dow scored a new all-time high, boosted by industrial conglomerate Honeywell International (NYSE:HON), which outperformed, after receiving an analyst upgrade. That offset the selloff of Boeing (NYSE:BA), after the company grounded dozens of 737 MAX jets to repair an electrical flaw that was discovered in recently delivered models.
As well, while the tech-heavy NASDAQ 100 posted a new record on Friday, at least on a closing basis, the Russell 2000, whose domestically listed firms often represented the reflation trade, underperformed—for the day as well as for the week, during which it was the only index in the red. The comparison of the two indices is telling as it represents yet another side to the reflation trade.
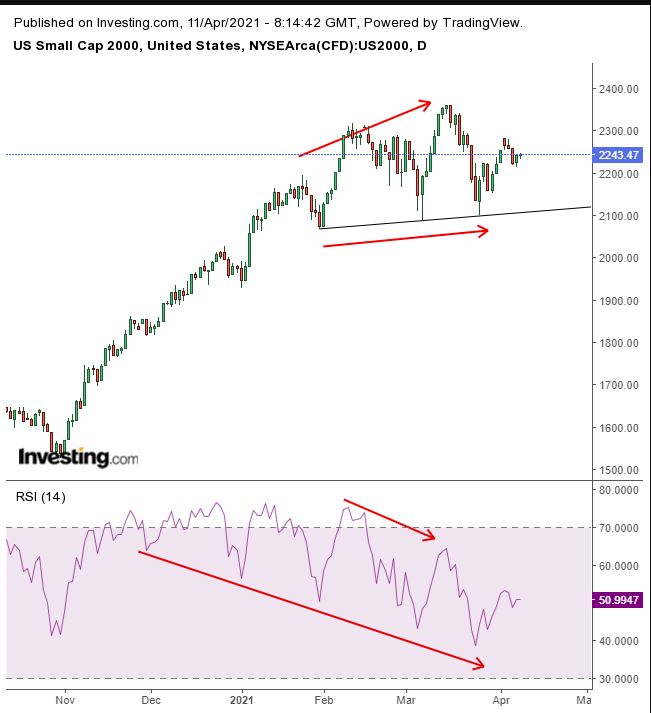
In addition, the small cap index is developing the weakest trading pattern:
A potential H&S top is unfolding on the Russell, coupled with a negative RSI divergence.
So why is this apparent Reflation Trade reversal happening? We can only speculate. Here are two reasons:
Since the March 2020 bottom, stocks have added an incomprehensible 85% in value, primarily because of the Fed promise to continuously support the economy and stocks. That is, the Fed will not tighten according to forecasts, but only on evidence of price stability and employment before the central bank will adjust rates.
Nevertheless, despite consistent data demonstrating an economic rebound in the US is picking up steam, investors appear to believe the Fed’s coaxing that inflation is not coming. We can see this clearly as the rally in rates dissipates.
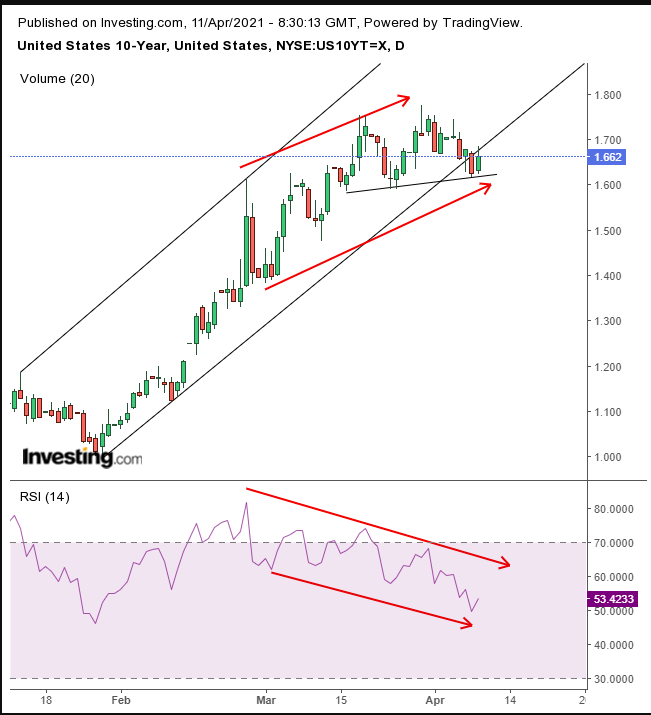
Yields, which have led stocks higher, are now moving sideways, increasing the odds of a top. The yield on the 10-year Treasury note fell below its uptrend line on Wednesday, but managed to close above it. It then slipped below the line again the next day but also closed below it.
While traders regained their composure and attempted to drive yields back above the uptrend line at the bottom of a rising channel, by continuing to sell Treasuries, rates nevertheless found resistance by the bottom of the channel. The RSI provided an obvious negative divergence between the rising price and the falling momentum, suggesting the price will fall below the top’s neckline.
Falling yields dragged the dollar lower.
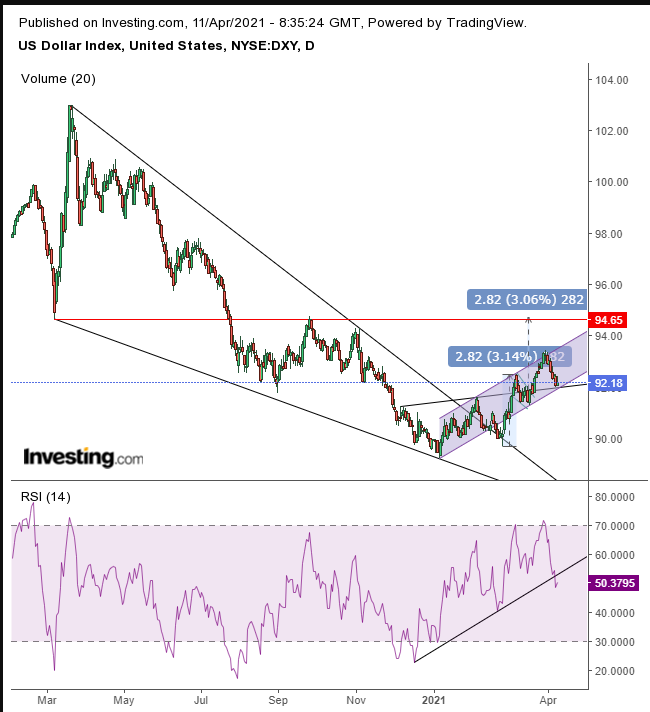
The greenback found a floor at the extended neckline of its double bottom, forming an inverted hammer (which requires a higher close to complete the bullish signal). That coincided with what we interpret may be the bottom of a rising channel, despite the five sessions, from Feb. 19-24, the USD spent below where we drew the bottom of the rising channel.
The RSI slipped below its uptrend line, suggesting the price may follow lower. However, we consider the recent decline to be a return move to the preceding falling flag, targeting the 39.50 area, after having completed a massive falling wedge since the March top. Note the level the flag is targeting, an obvious support-resistance level (red line) since the Mar. 6 low.
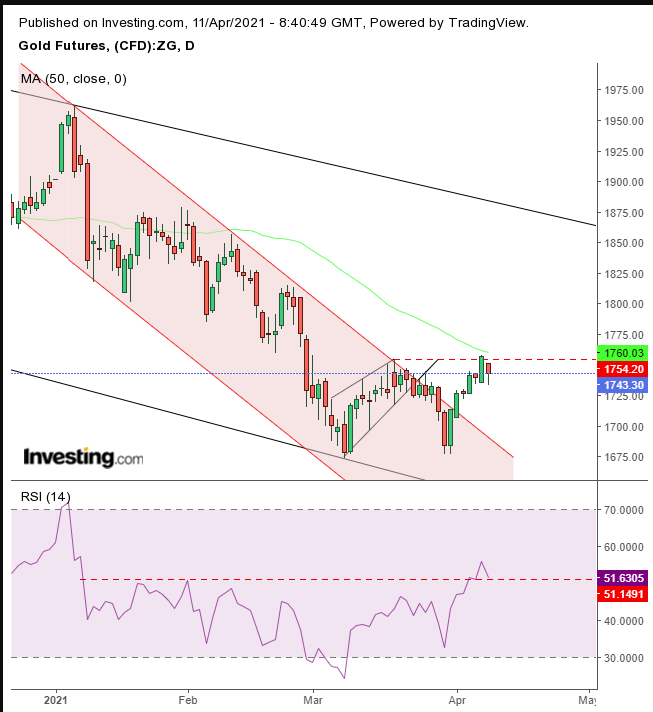
Gold is at a critical crossroads.
Bulls are giving bears an unexpected fight, breaking free of an express falling channel, within the broader, slower one since the March high. At the same time, the RSI broke its resistance and found support on Friday above it, despite heading lower.
Will the yellow metal now rise toward the top of its falling channel? As long as the 50 DMA showed up to protect the rising flag, we’re considering this advance part of a technical return move, before the price continues lower.
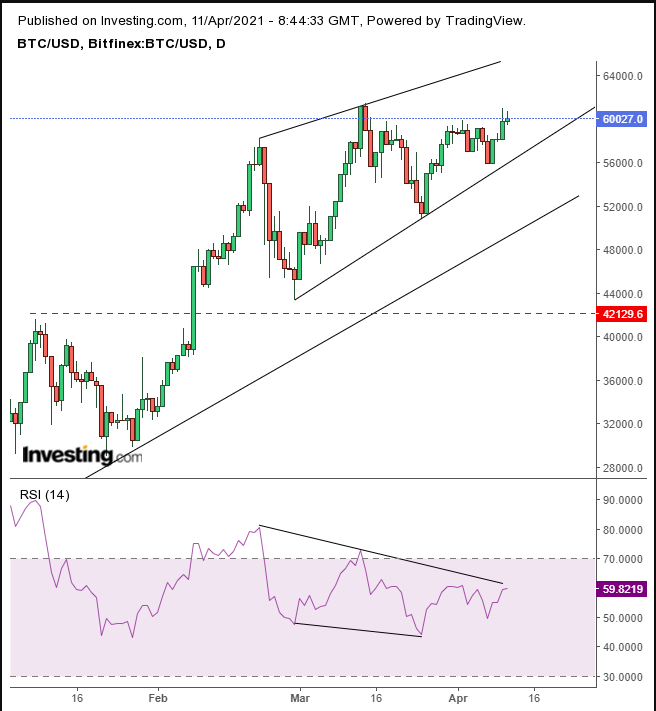
Bitcoin is retesting its Mar. 13 record close on chatter of shrinking supply.
However, an RSI divergence to what appears to be a rising wedge gives us pause. We want to see evidence of a new rally, before buying into one, or a correction that finds support above $54,000.
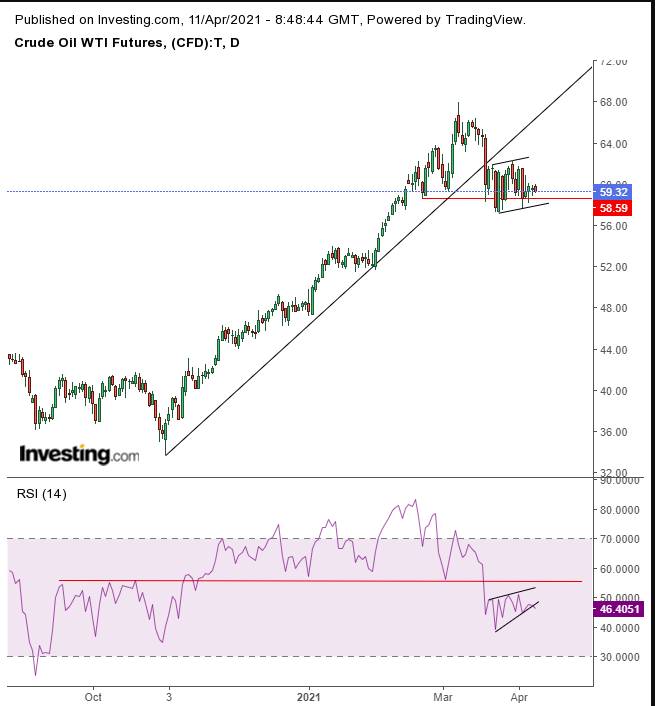
While OPEC+ has been cautious about raising oil output, US shale puts the price risk on the downside.
WTI has been trading within a highly congested rising flag. Like a tightly wound coil, it's waiting to spring. A downside breakout would also complete a H&S top, something the RSI has already done.
The Week Ahead
All times listed are EDT
Monday
23:00: China – Trade Balance: expected to plunge to $52.55B USD from $103.25B.
Tuesday
2:00: UK – GDP: anticipated to jump to 0.6% from -2.9%.
4:30: UK – Manufacturing Production: seen to surge to 0.5% from -2.3%.
5:00: Germany – ZEW Economic Sentiment: likely to edge higher to 79.5 from 76.6.
8:30: US – Core CPI: probably crawled up to 0.2% from 0.1%.
22:00: New Zealand – RBNZ Interest Rate Decision: forecast to remain unchanged at 0.25%.
Wednesday
10:30: US – Crude Oil Inventories: last week's print showed a drawdown of -3.522M bbls.
21:30: Australia – Employment Change: predicted to fall to 35.0K from 88.7K.
Thursday
8:30: US – Core Retail Sales: to surge to 4.8% from -2.7%.
8:30: US – Initial Jobless Claims: predicted to rise to 700K from 744K.
8:30: US – Philadelphia Fed Manufacturing: expected to fall to 43.0 from 51.8.
22:00: China – GDP: forecast to nearly triple to 18.8% from 6.5%.
22:00: China – Industrial Production: anticipated to more than halve to 15.6% from 35.1%, in negative correlation to GDP.
Friday
5:00: Eurozone – CPI: seen to remain flat at 1.3%.
8:30: US – Building Permits: to rise to 175M from 1.72M.
Related Articles

The recessionistas are now forced to look to the third quarter as the earliest start date for an economic downturn in the US. The odds have been low recently that Q2 would mark...

The U.S. Postal Service saw a downshift in change-of-address requests as labor markets shift and households are less likely to move and that’s impacting residential real...

We went from ‘the Federal Reserve (Fed) could hardly cut in September’ to ‘it would be a mistake not to cut in July or September’ (source: Mohammad El Erian’s LinkedIn feed) in...
Are you sure you want to block %USER_NAME%?
By doing so, you and %USER_NAME% will not be able to see any of each other's Investing.com's posts.
%USER_NAME% was successfully added to your Block List
Since you’ve just unblocked this person, you must wait 48 hours before renewing the block.
I feel that this comment is:
Thank You!
Your report has been sent to our moderators for review



Add a Comment
We encourage you to use comments to engage with other users, share your perspective and ask questions of authors and each other. However, in order to maintain the high level of discourse we’ve all come to value and expect, please keep the following criteria in mind:
Enrich the conversation, don’t trash it.
Stay focused and on track. Only post material that’s relevant to the topic being discussed.
Be respectful. Even negative opinions can be framed positively and diplomatically. Avoid profanity, slander or personal attacks directed at an author or another user. Racism, sexism and other forms of discrimination will not be tolerated.
Perpetrators of spam or abuse will be deleted from the site and prohibited from future registration at Investing.com’s discretion.