Even with coronavirus fears escalating, and the death toll rising to more than 1,600 over the weekend, including the first reported fatality outside of Asia, U.S. indices finished higher for a second week. Indeed, both the S&P 500 and NASDAQ Composite closed at new all-time highs on Friday, finishing the trading week on an optimisitc note.
However, Treasurys and gold also climbed, signaling that investors continue to be cautious.
Is It Risk-On Or Risk-Off?
With regard to where markets might be headed, we find ourselves of two minds. On the one hand, we've turned unenthusiastically bullish recently, because equities blew out of long-term bearish ranges, maintaining uptrends despite a host of concerns about the fundamentals. Still, it's now late in the business cycle of the longest bull market on record, driven by unprecedented stimulus that has allowed investors to turn a blind eye to such real risks as a Phase One U.S.-China trade agreement that barely offers any sort of resolution, among other concerns.
So, though we've turned tepidly bullish again, we're also remaining on the alert for any signs of a market top, at long last. However, because of the ongoing epidemic worries, we don’t think this will occur right now. Thus, even with deep global concerns about Covid-19, we still find ourselves begrudgingly defending the market's upward trajectory.
Case in point, stocks retained their strength last week, notching fresh records no less, even after the director-general of the World Health Organization (WHO) said, just a week ago, that the known cases thus far may be just “the tip of the iceberg.” At this juncture then, all investors have to decide is whether these new highs are a sign of strength for equities, as investors maintain their faith in economic growth, or whether this only just irrational exuberance buoyed by a bubble—something that's increasingly difficult to gauge. One thing is for certain, however: we expect considerable volatility, with a target rich environment for short and medium-term traders.
The S&P 500 pushed higher on Friday (+0.18%), to a new all-time-high, with Real Estate, (+1.16%), responsible for the advance. Energy, however, was a drag on the index, (-0.53%).
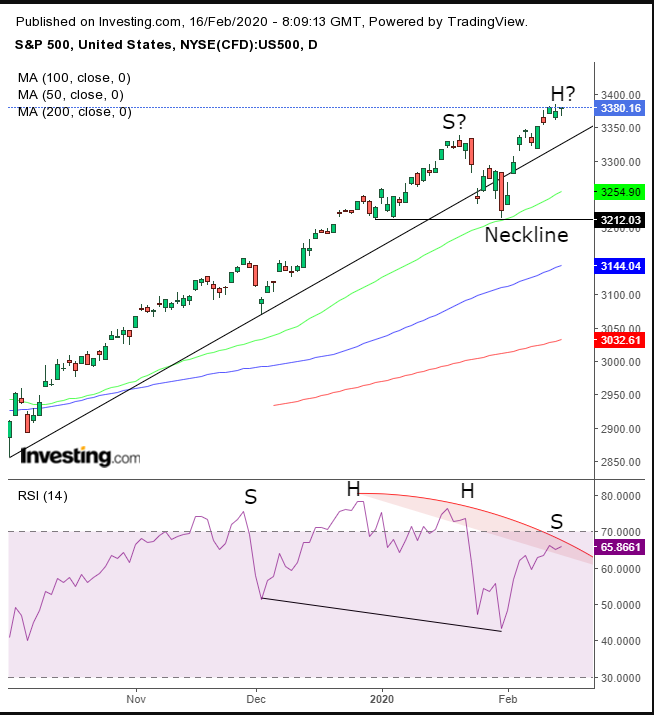
Nonetheless, for the week, the SPX gained 1.58%. It is the second weekly advance in a row, which has seen the benchmark move up in eight of the last ten days—notching a new record every two-and-a-half days, as the index rose in 15 of the last 19 weeks.
Keeping with tradition, we resubmit our warning of a potential correction, as the price’s struggle to make a new leg in the uptrend feels like a possible H&S top in the making. The RSI may be forming the same pattern, providing a negative divergence with both highs and lows falling in contrast to the price in the same duration.
The NASDAQ Composite also made a new record, (+0.2%). Technically, the tech-heavy index was the mirror image of the SPX.
The Russell 2000 underperformed, (-0.4%); the Dow Jones Industrial Average edged lower (-0.09%).
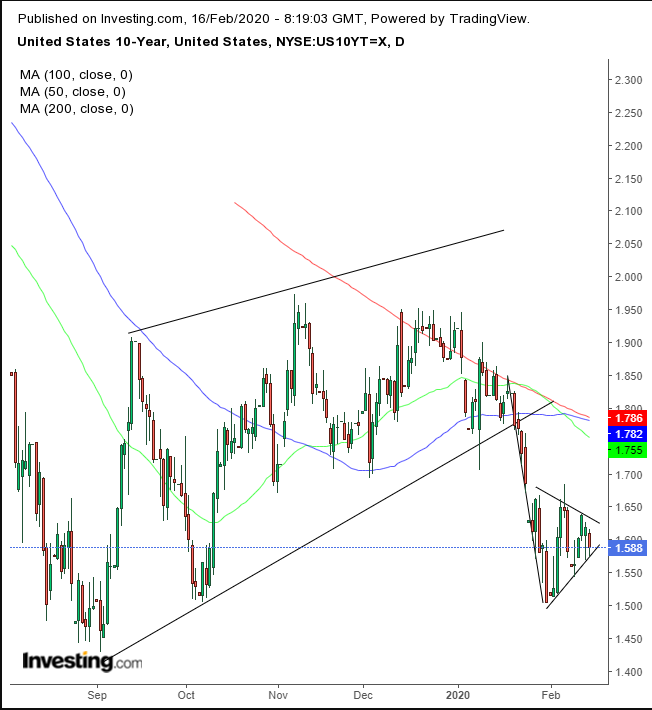
While equities keep carving out new highs, Treasury yields, including for the U.S. 10-year, fell to the lowest level since October, while developing a pattern suggesting further declines, to test the Sept. 3 lows of 1.4.
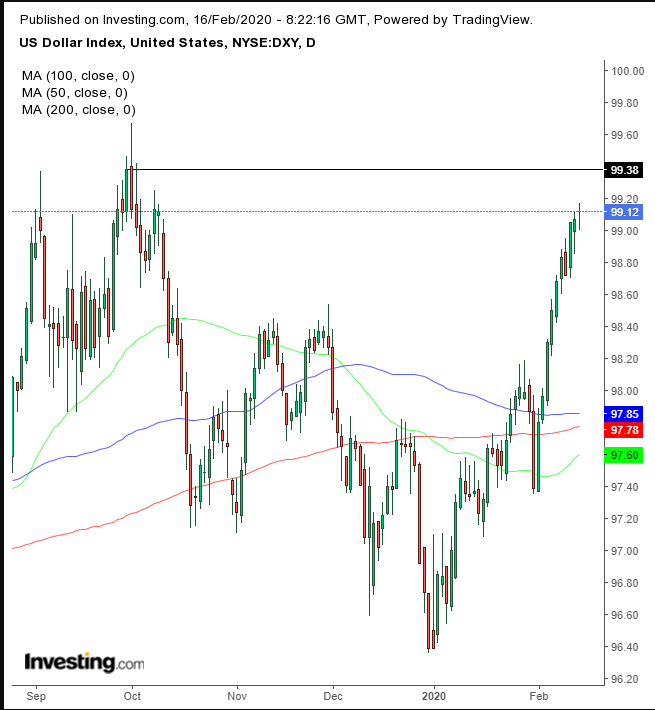
The dollar closed above 99.00 to finish the week, the first time since Oct. 9, taking aim at the Sept. 30, 99.38 high, necessary to maintain the uptrend since the February 2018 bottom.
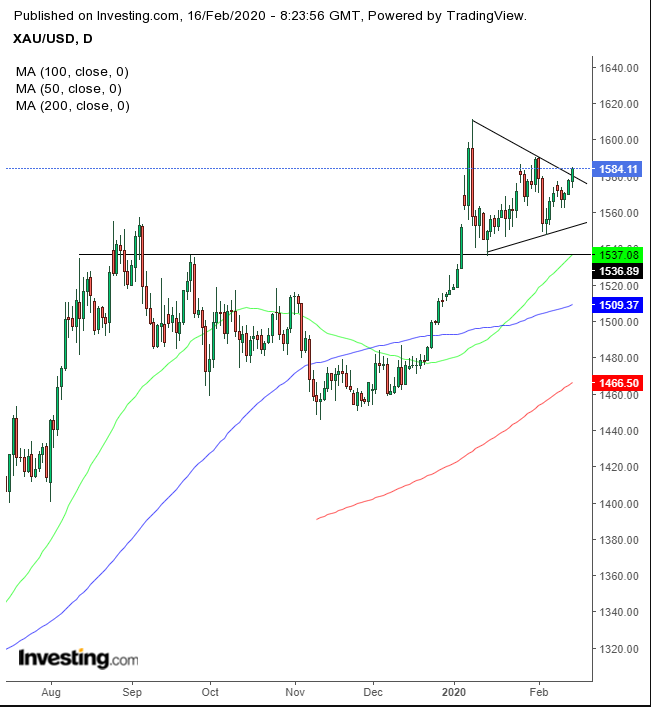
Gold closed above a continuation pattern, raising the odds for an upside breakout and an extension of the preceding uptrend.
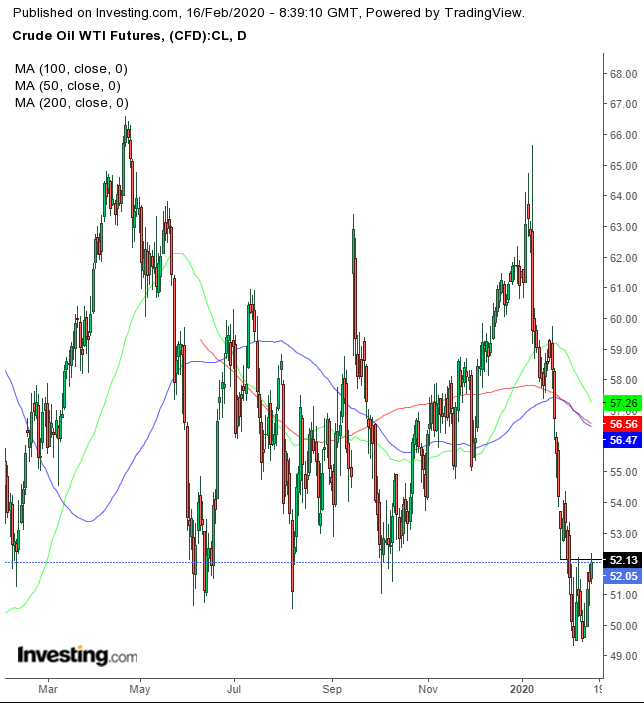
Oil has had a particularly rough ride. It was first pressured by the trade war, then, more recently, squeezed by the coronavirus. Now, Libya is expected to deny the market its output. Perhaps, that would push the price above its resistance since June.
Overall, we maintain the position that the impact of Covid-19 on the economy will be short-term, based on the history of similar, previous epidemics. But of course, only time will tell.
Week Ahead
All times listed are EST
Sunday
18:50: Japan – GDP: expected to drop to -0.9% from 0.4% QoQ and plunge to -3.7% from 1.8% YoY.
Monday
19:30: Australia – RBA Meeting Minutes
Tuesday
5:00: Germany – ZEW Economic Sentiment: expected to fall to 22.0 from 26.7.
Wednesday
4:30: UK – CPI: likely climbed to 1.6% from 1.3%.
8:30: U.S. – Building Permits: forecast to climb to 1.450M from 1.420M.
8:30: U.S. – PPI: probably edged down to 0.1% from 0.2%.
8:30: Canada – Core CPI: expected to edge higher to 1.8% from 1.7% YoY.
14:00: FOMC Meeting Minutes
Thursday
11:00: Crude Oil Inventories: expected to plunge to 2.987M from 7.459M.
Friday
3:30: German – Manufacturing PMI: seen to slow further to 44.8 from 45.3.
4:30: UK – Manufacturing & Services PMI.
5:00: Eurozone – CPI: likely remained flat at 1.4%.
10:00: U.S. – Existing Home Sales: predicted to plummet to -1.8% from 3.6%.
