Investor optimism hits four-year high, BofA survey finds
- Surge in COVID-19 cases prompts renewed lockdowns
- US stocks still finish week on a high after third-best quarter ever
- Dollar slump continues
As trading came to a close on the holiday-shortened week, the S&P 500, Dow Jones and NASDAQ pushed higher after monthly jobs data proved more robust than expected. It was another positive milestone following the best quarter for the S&P 500 in 22 years and the strongest quarterly performance for the Dow since 1987.
Still, exuberance was tempered by the realities of COVID-19: the number of confirmed cases in the US continues to rise, currently closing in on 3 million, with spikes across the South and West. Florida and Texas reported new record high, daily case confirmations on Saturday with some states suspending, or even reversing reopening plans.
Good economic news nothwithstanding, the pandemic spread continues to weigh on the V-shaped recovery narrative many investors have been counting on.
Wild First 6 Months But Equities Still Down 4% YTD
Having reached the midway point of 2020, it's worth looking back at where we've been—and where, perhaps, we might be headed. Equities are down 4% YTD, but unless you’ve been in a coma, you're well aware of what a wild ride it's been over the first six months of this year.
At the start of 2020, markets hit new all-time highs, but in March those heights were toppled by the global spread of coronavirus. Stocks rapidly tumbled into the most acute bear market plunge in history; the pandemic also fostered the sharpest recession since the 1930s.
But investor appetite for risk—fueled by unprecedented government and central bank stimulus—triggered what ended up being the fifth best quarterly advance in the postwar era.
Though we've been consistantly bearish on the markets, now would be an appropriate time to acknowledge how wrong we’ve been. Granted, we still can’t wrap our minds around how enthusiastically investors have been willing to risk their money during the worst global pandemic in one hundred years amid devastating economic data.
The only explanation we can come up with is the unprecedented amounts of fiscal and monetary aid being handed out globally. Whether we believe the Fed can, in fact, provide “infinite QE,” what matters is that investors, it appears, have completely bought into the idea.
To be clear, we still don’t trust this rally. We see it as having been built on hopes and dreams of an alternative economy—on steroids. We never would have imagined stocks would do anything but collapse below the March lows, not to mention provide some of the best returns of all time.
Plus, some of the statistics are stunning. For stocks:
- While US equities ultimately fell 4% in the first six months of the year, traders enjoyed a target rich environment, with some of the best upside reversals many may not have seen during their entire careers till now, including a 35% drop from record peaks in February to a 44% surge from the March bottom and finally a second quarter that rebounded into the 3rd strongest quarter in the same period (’75, ’87)
- The current, $10 trillion rally hinges on earnings results no one yet has a clue about. Over the last three months, given the level of health- and economy-related uncertainty, 80% of S&P 500 firms didn't provide forward guidance.
For the economy:
- The longest expansion for the US finally came to a halt, contracting 5% in the first quarter of 2020, the sixth sharpest drop since 1950, the worst economic decline since the Great Depression.
- One could use recent economic data—including a powerful rebound in home sales, consumer confidence, manufacturing and jobs—to posit the country is finally recovering. But the rebounds may also be so sharp because they followed earlier, record declines. The real trick will be for future releases to maintain this momentum.
Moreover, given that investor optimism was so high when the outlook for restarting the economy was still fresh, will that perspective persist if new lockdowns or rollbacks accelerate in tandem with the rising number of COVID-19 cases?
Dollar, Gold, Oil All Slip
Though the S&P 500 closed higher for the week, it was the fifth straight week of whipsaw conditions, with no two weeks of activity in the same direction. This makes reading the technicals more difficult, but here's how we see it:
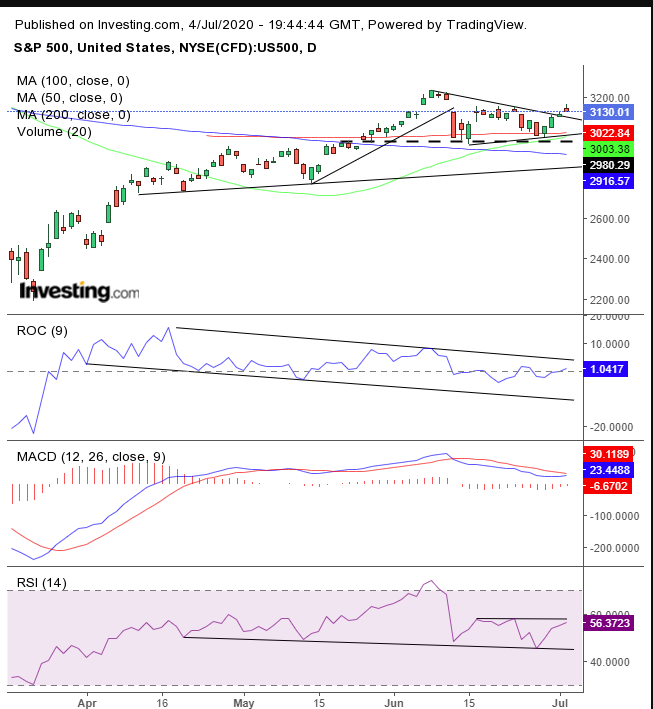
Our interpretation is that on the current daily chart, the SPX is forming a descending triangle, which may be the head of a H&S top. However, the breakouts on Wednesday and Thursday had us thinking perhaps it had been a pennant or symmetrical triangle all along.
On the other hand, the last two days of trading, albeit on light volume, produced small real bodies, with Thursday’s shooting star suggesting the breakout is weak.
All indicators seemed to support that argument. The 50 DMA lost wind and trended below the 200 DMA. The MACD’s short MA failed to cross the long MA, remaining within the bearish formation. Both momentum indicators, the ROC and the RSI, provided negative divergences to the price. The ROC was trading within a falling channel and the RSI was developing a H&S top—which is what we expected of the price.
While we may not be comfortable with the breakout, it is, still, a breakout. Therefore, we would wait to see whether it finds sufficient demand to keep it above the triangle and propel it higher, or whether it will languish back into the pattern.
The VIX fell on Thursday. Nonetheless, it closed well above its lows.
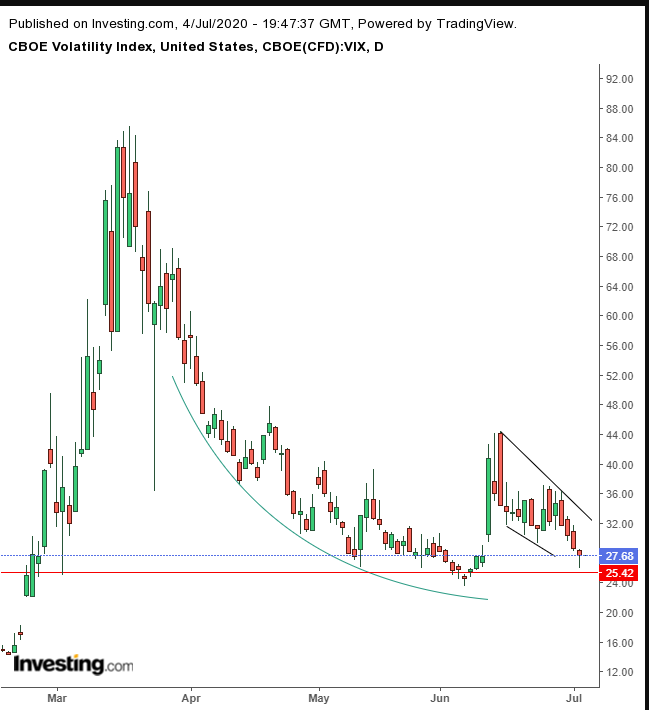
The activity produced a hammer, right above the broken resistance since May (red line), still within the falling pattern. An upside breakout would resume the rounding bottom formation (green curved line).
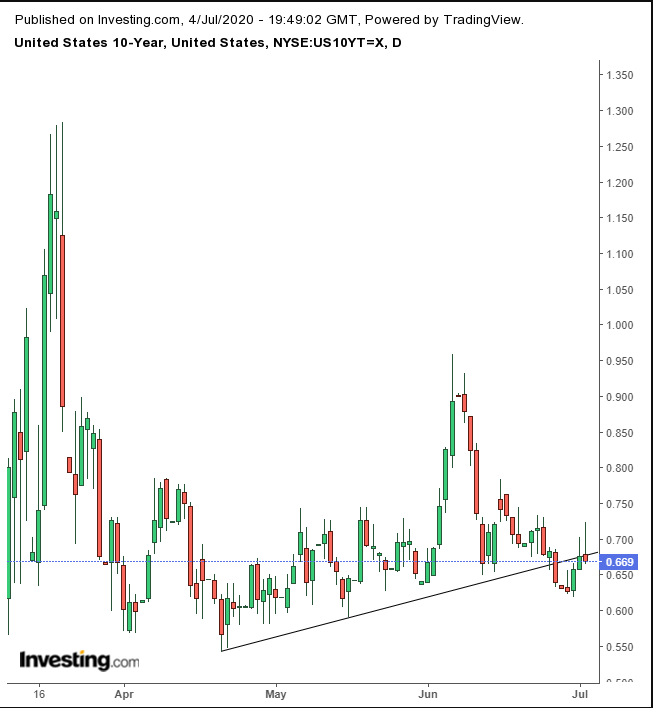
In a mirror image of the VIX, yields, including for the 10-year Treasury note, produced a shooting star with an exceptionally long upper shadow, closing for the second day below the broken uptrend line since April 21.
Thursday’s hammer for the Dollar Index reinforced the uptrend line that includes the June 23 low, broadening the rising flag.
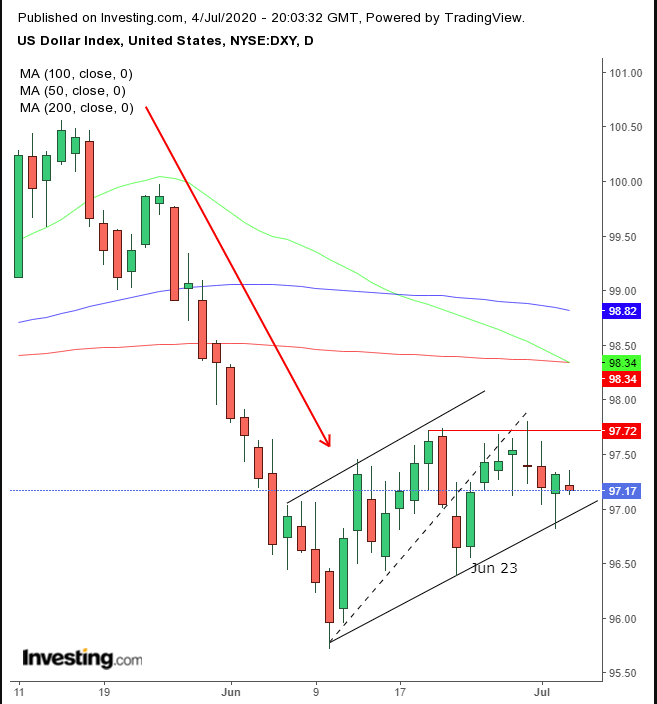
This pattern is presumed to be a pause in the trend, a time when traders cash out after the strongest declines for the USD in a year, while new bears take their place. After the contracts trade hands and the demand produced by short coverings dries up, a downside penetration would signal another leg lower.
Meanwhile, the 50 DMA is breathing down the neck of the 200 DMA, threatening a death cross. The 200 DMA is even falling, making it a much more potent bearish signal.
On the fundamental side there's reason to be concerned as well regarding the next move for the global reserve currency. Thursday’s Nonfarm Payrolls release may have smashed expectations, but the dollar didn’t surge. It did rebound late in the session, but fell again Friday.
Gold managed to maintain gains after a crucial upside breakout of a symmetrical triangle—including a falling flag—that followed a continuation H&S pattern.
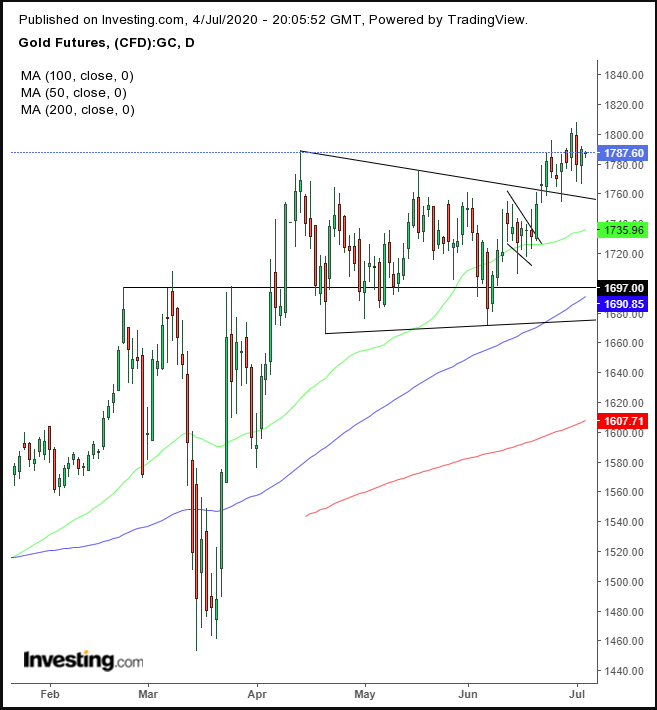
Note: on Thursday, the precious metal rose even as the dollar strengthened. It fell on Friday, even as the dollar weakened.
On Friday, oil trimmed half of Thursday’s advance.
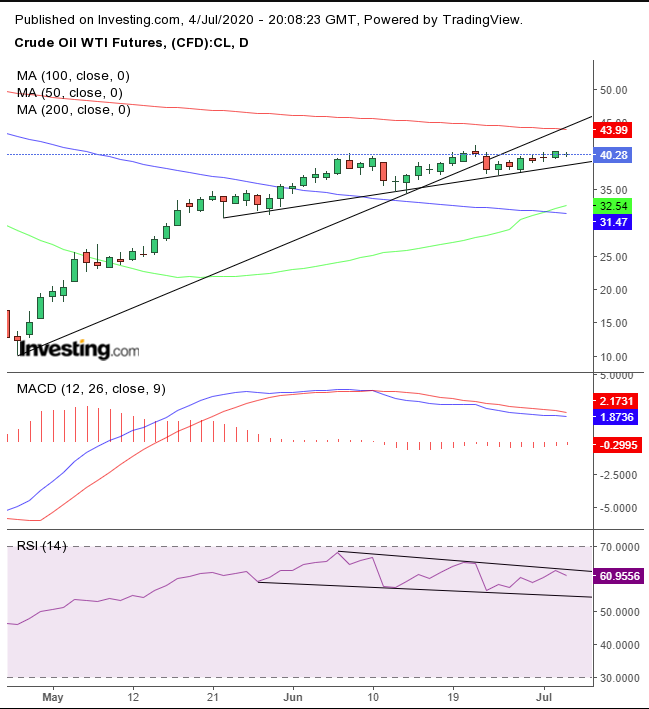
Technically, the price may be topping, after falling below the uptrend line since April 28, below the 200 DMA. Both the MACD and the RSI provided negative divergences, each falling against rising prices.
The Week Ahead
All times listed are EDT
Monday
4:30: UK – Construction PMI: expected to surge to 47.0 from 28.9.
10:00: US – ISM Non-Manufacturing PMI: seen to pop to 50.0—the red line between expansion and contraction—from 45.4.
Tuesday
00:30: Australia – RBA Interest Rate Decision: forecast to keep rates at 0.25%.
10:00: US – JOTLs Job Openings: probably receded to 4.850M from 5.046M.
10:00: Canada – Ivey PMI: May's print came in at 39.1.
Wednesday
Tentative: BoE MPC Treasury Committee Hearing
10:30: US – Crude Oil Inventories: anticipated to surge to -0.710M from -7.195M.
Thursday
8:30: US – Initial Jobless Claims: expected to decline to 1,375K from 1,427K previously.
Friday
8:30: US – PPI: seen to remain flat at 0.4%.
8:30: Canada – Employment Change: expected to soar to 800.0K from 289.6K.
