- Rallies driven by earnings beats
- GDP headline smashes expectations, but holds worrisome data
- Hedge fund volatility shorts at record levels
Earnings beats helped U.S. equities finish the week with fresh records for the S&P 500 and NASDAQ. We're therefore upgrading our recommendation from “sell” to “hold.”
However, we do this grudgingly. A number of concerns we've noted previously remain in effect: yields extended a decline, inflation continues to fall and the low participation rate is ongoing. Along with better than expected earnings, central bank 'intervention' and an outlook for the end of the trade war may have helped boost stocks to unprecedented heights, but the structural risks remain a concern.
Can Central Banks Actually Create Growth?
Friday's better-than-expected GDP may in fact illustrate this perfectly. While the headline number, 3.2%, blew right through expectations, a deeper drilldown reveals the boost came entirely from rising inventories, rather than sales, and exports (more on this below). However, both segments, inventories and exports, are expected to reverse soon. Also, consumer demand— which accounts for two thirds of the U.S. GDP—was weak.
This, therefore, may be the single most important question for investors: can central banks create growth, as inflation remains low and an aging U.S. population consumes less as they grow older? Meanwhile, the core personal consumption slumped from an already tepid 1.8% to 1.3%, risking deflation a la Japan in the 1990s.
As things stand, despite the Fed’s balance sheet having more than quintupled, from $800 billion in late 2008 to a peak of $4.5 trillion by 2015, inflationary pressures have remained dormant.
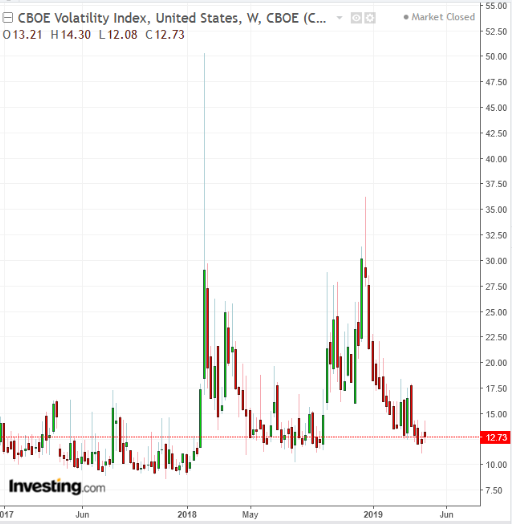
Chart powered by TradingView
The VIX is nearing its lowest levels since 2018 and hedge funds are increasing short positions to record levels. According to CTFC data, VIX futures contracts were at 178,000—the most on record since 2004. Clearly, money managers seem to unanimously agree that volatility will continue to ease. To us, that smacks of complacency, a leading indicator that could signal a risk of increased volatility ahead.
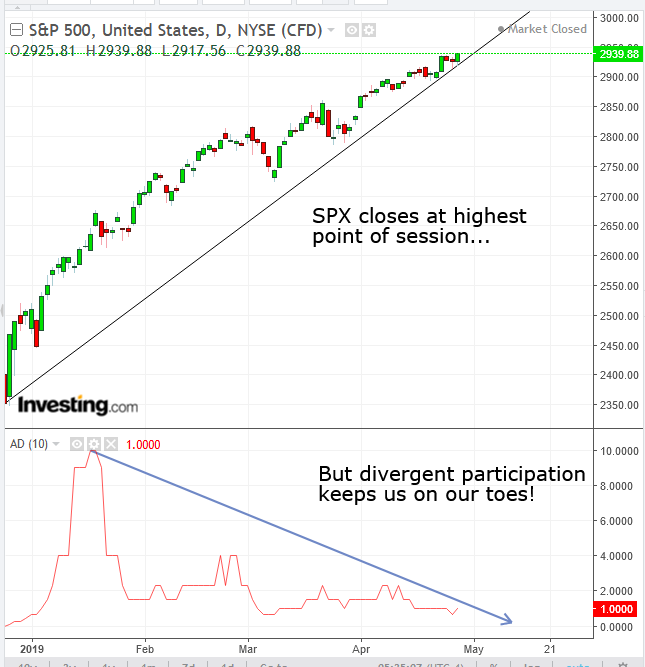
Chart powered by TradingView
The S&P 500 Index capped a double record, both on a closing basis as well as a new all-time high, as positive earnings surprises from e-tail giant Amazon (NASDAQ:AMZN) and U.S. automaker Ford (NYSE:F) overshadowed disappointments from chipmaker Intel (NASDAQ:INTC) and oil and gas behemoth Exxon Mobil (NYSE:XOM). Technically, the benchmark index posted a simultaneous record close and all-time high, as it finished at the very highest point of the session, demonstrating that traders were all-in and highly committed to a weekend position.
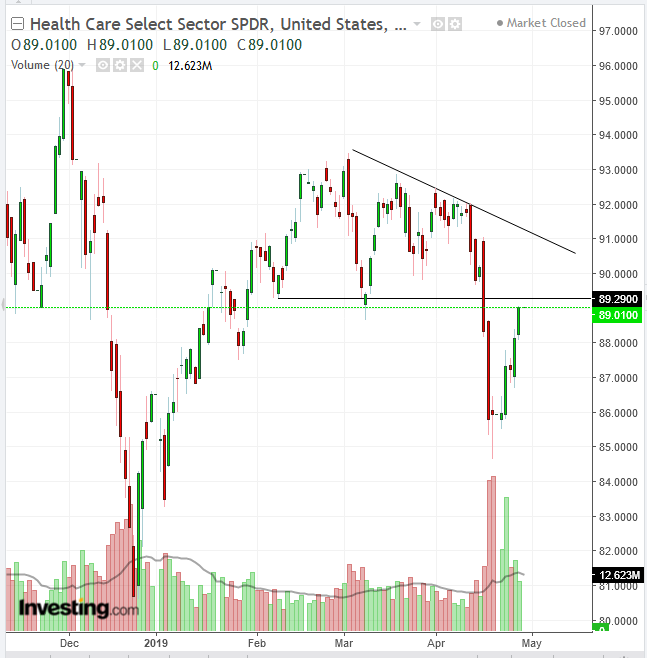
Chart powered by TradingView
The SPX jumped 0.47% on Friday, with 9 out of 11 sectors in the green; Health Care (+1.00%) outperformed. For the week, the S&P 500 advance 1.2%, and once again health care (+3.6%) outperformed. Technically, however, the sector may have just encountered a dearth of runway, as heavy breakout-volume was followed by a return move with shriveling volume to a completed descending triangle.
The trading pattern makes sense. Dip buyers have been acquiring the sector on fears of what “health care for all” would do to the industry. Thus the sector may still see additional declines ahead.
Like the S&P, the NASDAQ Composite also set a fresh record close, after Thursday’s new all-time high. The tech-heavy index also closed at the height of the session, as bulls remained in control on the all-important pre-weekend close, when they would be stuck with equities at record highs, irrespective of any geopolitical headwinds that could occur before Monday's open.
However, both the Dow Jones Industrial Average—which was +.031% Friday but only +0.18% for the week, though it closed at the top of the session—and the Russell 2000—which surged 0.84% Friday and 1.67% for the week, outperforming over both periods—have yet to reach new records. The Dow is 0.92% below its October record close while the Russell 2000 is 9.33% from its Sept. 4 record close.
Charles H. Dow, the founder of the Dow indexes theorized that confirmation between the Industrial and Transportation averages is required for a bull (or bear) market to be in affect, since it isn’t enough for Industrials simply to manufacture goods, they must sell them as well, as reflected by Transports. Currently, the Dow Jones Transportation Average is lagging industrials. It's 6.33% below its Sept. 14 closing record.
While basic technical principles might dictate a bullish call for the S&P and NASDAQ based on double records with bullish closes, structural market and economic weakness make us wary of issuing such a call. This may mean we miss a rally, even if it's based on the greater fool theory, when investors buy with no regard for market fundamentals but rather on the irrational belief they'll be able to sell at a higher price as markets keep on rising. The key action item, however, is to make sure the greater fool isn’t you.
Week Ahead
All times listed are EDT
Monday
21:00: China – Manufacturing PMI: expected to edge up to 50.7 from 50.5.
21:00: China – Non-Manufacturing PMI: seen to eke out a gain to 55.0 from 54.8.
21:45: China – Caixin Manufacturing PMI: expected to have climbed to 51.0 from 50.8
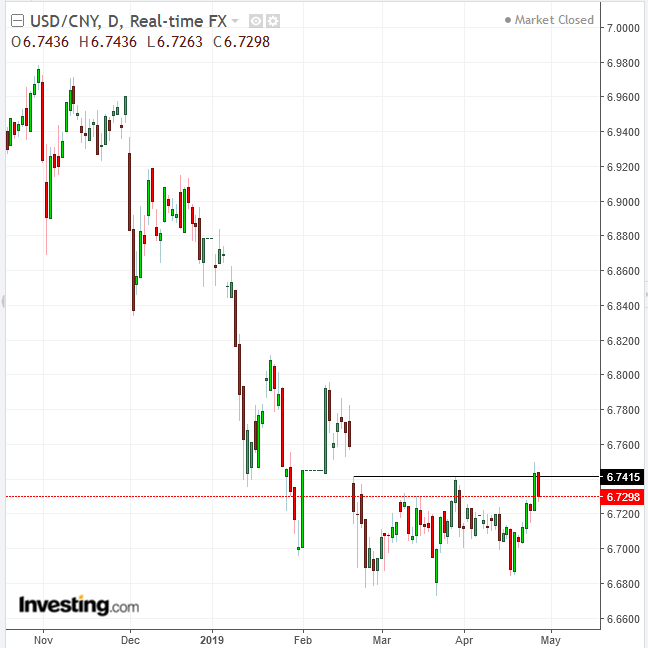
Chart powered by TradingView
The dollar-yuan pair found resistance by the neckline of a triple bottom. An upside breakout would suggest the Chinese currency had hit a bottom.
Tuesday
3:55: Germany – Unemployment Change: seen to crawl to -6K from -7K.
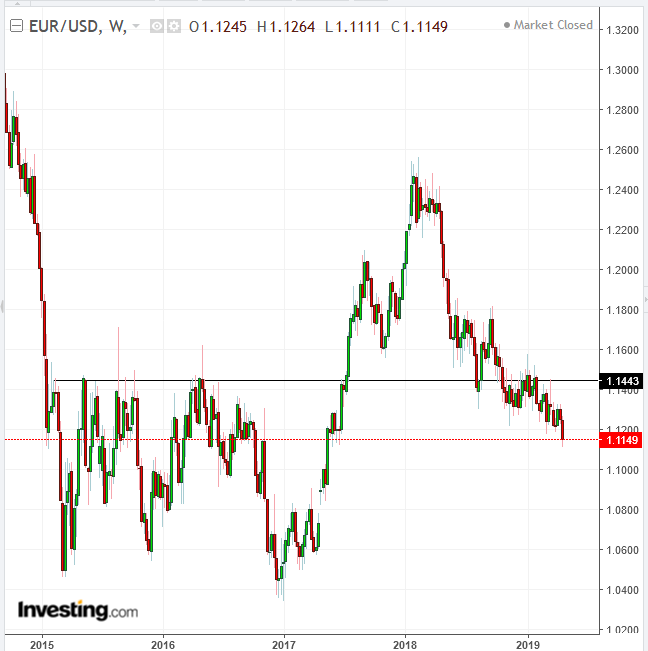
Chart powered by TradingView
The euro fell to its lowest versus the dollar since May 2017. The next major support will be at around 1.0500.
8:30: Canada – GDP: likely to have dropped to 0.1% from 0.3% MoM and down to 1.4% from 1.6% YoY.
10:00: U.S. – CB Consumer Confidence: expected to climb to 126.0 from 124.1.
10:00: U.S. – Pending Home Sales: likely to have jumped to 1.1% from -1.0%.
11:00: Canada – BoC Gov Poloz Speaks
18:45: New Zealand – Employment Change: forecast to surge to 0.5% from 0.1% QoQ.
Wednesday
4:30: U.K. – Manufacturing PMI: predicted to drop to 53.2 from 55.1.
8:15: U.S. – ADP Nonfarm Employment Change: outlook is 181K from 129K.
10:00: U.S. – ISM Manufacturing PMI: seen to edged down to 55.0 from 55.3.
10:30: U.S. – Crude Oil Inventories: expected to plunge to 2.093M from 5.479M.
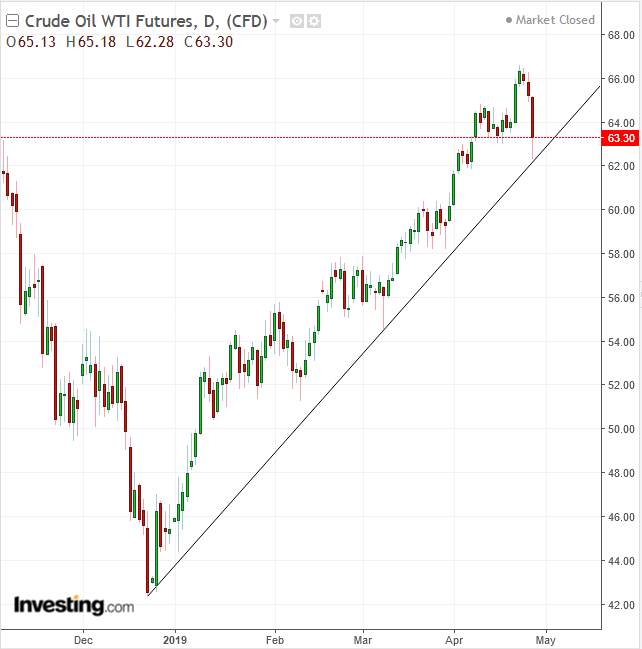
Chart powered by TradingView
The price of oil slipped for the past three trading days, erasing almost all of April’s gains. However, price found support above the uptrend line since the December bottom.
14:00: U.S. – Fed Interest Rate Decision: consensus is the Fed will keep rates at 2.50% till 2020, at which points opinions differ on the trajectory of rates.
Thursday
3:55: Germany – Manufacturing PMI: expected to remain unchanged at 44.5.
4:30: U.K. – Construction PMI: expected to have risen to 50.4 from 49.7.
7:00: U.K. – BoE Inflation Report; BoE Interest Rate Decision: expected to keep rates at 0.75%.
7:30: U.K. – BoE Gov Carney Speaks
Friday
4:30: U.K. – Services PMI: predicted to advance to 50.4 from 48.9.
5:00: Eurozone – CPI: seen to rise to 1.6% from 1.4% YoY.
8:30: U.S. – Nonfarm Payrolls: analysts expect 181K new jobs created, down from 196K last month.
8:30: U.S. – Unemployment Rate: probably remained at 3.8% for the month of April
10:00: U.S. – ISM Non-Manufacturing PMI: forecast to rise to 57.2 from 56.1
