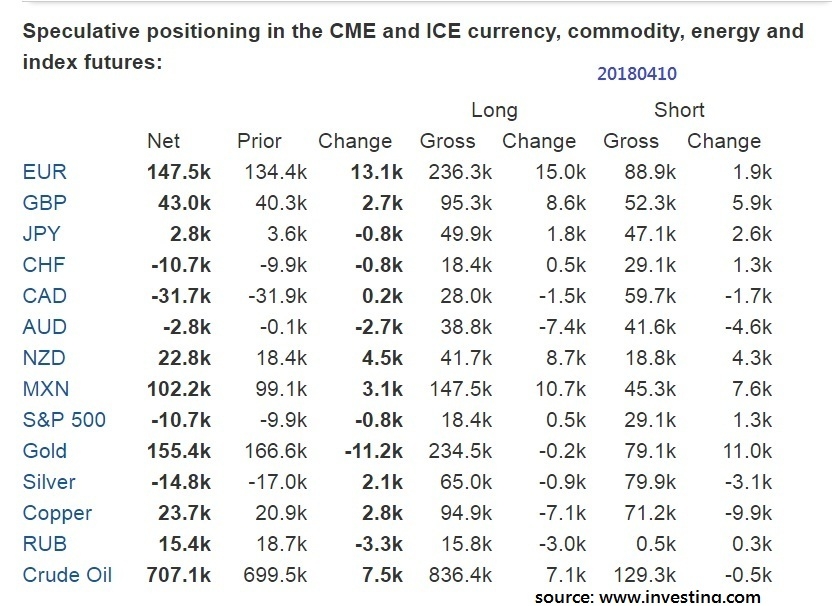
Quite an event over the weekend with the US, France and UK launched an attack on Syria, after a week of Trump’s tweet of missile threat on Russia. A week before, it was interesting to note that large speculators flipped to net long on Yen; and as of last Tuesday, April 10th, the net long is still intact at about 2,800 contracts. Not big, but worth paying attention to when the smart money flipped their positions. Something similar happened on the CoT report ending March 27, 2018, when large speculators flipped to net short abruptly from net long 24.6k to net short -27.1k contracts. The largest change of that week for -51.6k contracts and three weeks before the Bank of Canada rate decision scheduled for this week. Does ‘smart money’ expect some surprise from BoC?
Let’s take a look at the Commitment of Traders as they were reported ending April 10th:
Looking at the above table, large speculators are more bullish on Euro, Sterling, Kiwi, Peso, Copper and Crude, while less bullish on Gold, Ruble, and Yen. At the same time, they are more bearish on S&P 500, Swiss and Aussie, while less bearish on Loonie and Silver.
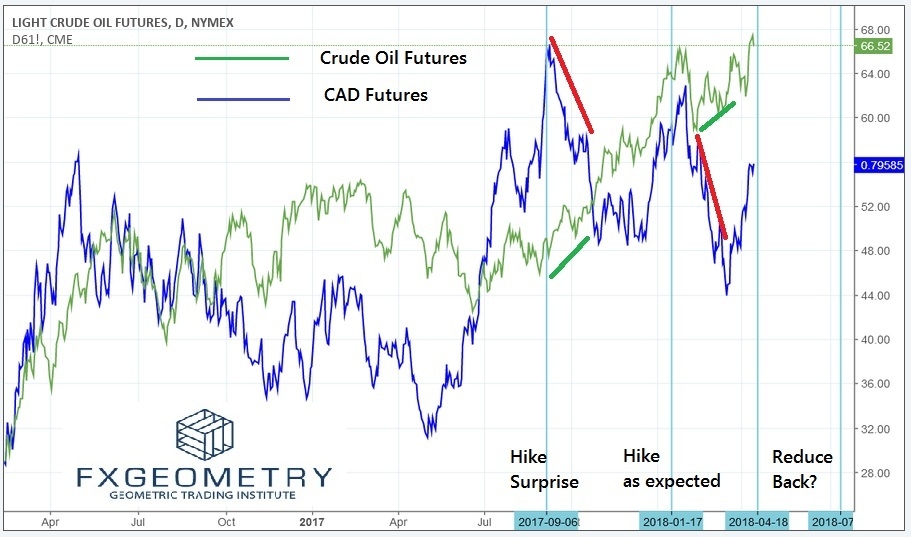
It’s interesting to note, that while speculators are net long on Crude Oil, they are net short on Loonie. The two are usually on positive correlation, that is more demand for oil means more demand for Loonie. Thus, having a negative one would make us wonder. Let’s take a look at Crude and CAD/USD overlay.
After the financial crisis 2008, over a period of 7 months, BoC reduced rates from 3% to merely 0.25%, to help kick start the economy. 9 months after that, BoC had a 75 basis points hikes over a period of 3 months - June, July, Sept 2010 - making the overnight rate at 1%. The rate stood for 4 years and 4 months, before BoC reduced rate back to 0.75% in Jan 2015 in reaction to the declining oil price. The move surprised most market participant though there were reasons enough to see it coming with the oil price. BoC made another surprise in July the same year, when rate was cut to 0.5%; which saw USD/CAD rose more than 1,800 pips over 20 weeks.
Enough with negative surprise, BoC met market expectation for 25 basis points hike to 0.75% in July last year; only to surprise market in Sep with a hike back to 1%. Such a wild ride with Governor Poloz! After the last hike in January that made rate at 1.25%, could it be that market is looking for another reduction? There have been talks for a reduction in July, and if that is the case, it won’t be a surprise that large speculators are positioning themselves for such move.
So what would be a good trade this week? Following the leads on CAD, we should see GBP/CAD rise faster than USD/CAD as BoE is expected to hike as early as May when 2 of the BoE members voted for a hike last month; while Feds hike is pretty much on course. This should see Sterling on the up-move again to test pre-brexit high. We leave the liberty of checking the charts for you.
Happy Geometric Pipping!


