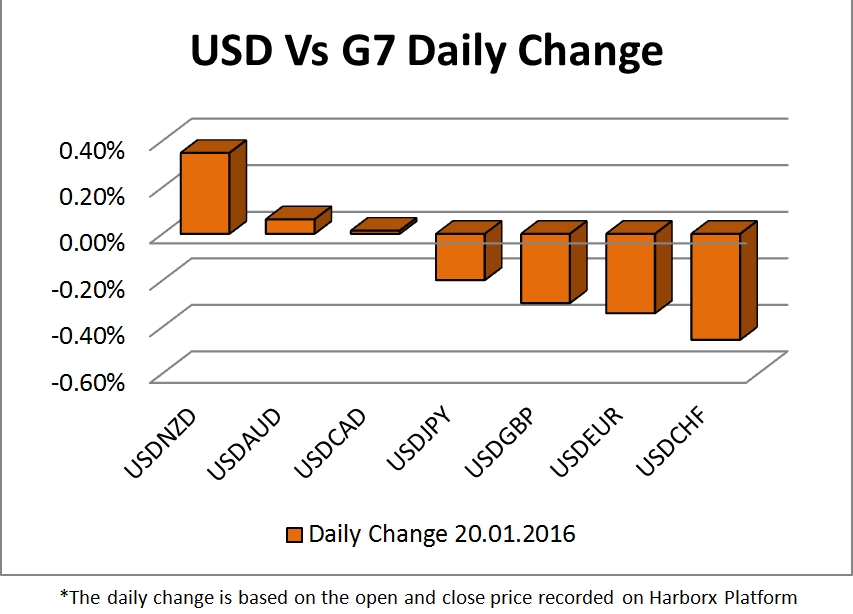
On Friday, January 20th 2017, America officially got its 45th President: Mr. Donald Trump. During his inaugural speech, Trump revisited the main aspects of his presidential campaign, such as protectionism and the need for increased border security, but again he failed to address specific fiscal plans. The lack of specifics pushed the dollar lower against the Swiss franc, euro, British pound and the Japanese yen while it managed not to drop against the commodity currencies.
During Monday’s Asian and European session, the US dollar kept falling against its major counterparts, with EUR/USD reaching 1.075 and the safe haven of USD/JPY testing the level of 113. Since investors are interested in clarity regarding the new President’s plans, the US dollar may fall further during this week if specifics about the new President’s policies are not released soon. Meanwhile, President Trump’s comments on Twitter are getting great interest from investors since they have brought volatility in the markets lately.

It’s also a Brexit week: the Prime Minister Theresa May will submit her industrial strategy today, while on Tuesday the Supreme Court will rule on who can trigger Article 50 of the Lisbon Treaty and whether or not Theresa May can be the one to trigger Brexit. EU rules allow for up to 2 years of negotiations when a country decides to leave the EU and before the official agreement between the EU and UK is announced.
Moreover, Theresa May is the first foreign leader to meet with President Donald Trump after the inauguration day; they are going to meet on Friday to discuss the post-Brexit trade deal. Hence, make sure that you keep an eye on the British pound this week, which has been appreciating back so far.
The rest of the economic calendar is generally light for this week. Tomorrow we are looking for the US Existing Home Sales data announcement which is expected lower than the last month while on Wednesday the Australian CPI is going to be released with expectations laying at 0.7%. During Thursday’s European morning the quarterly and annual UK GDP for the 4th quarter of 2016 are expected at 0.5% and 2.1% respectively, both 10 basis point lower than the last release. During Thursday’s US session, December’s US New Home Sales will be published while on Friday we are looking for the US GDP.
Technical View
EUR/USD
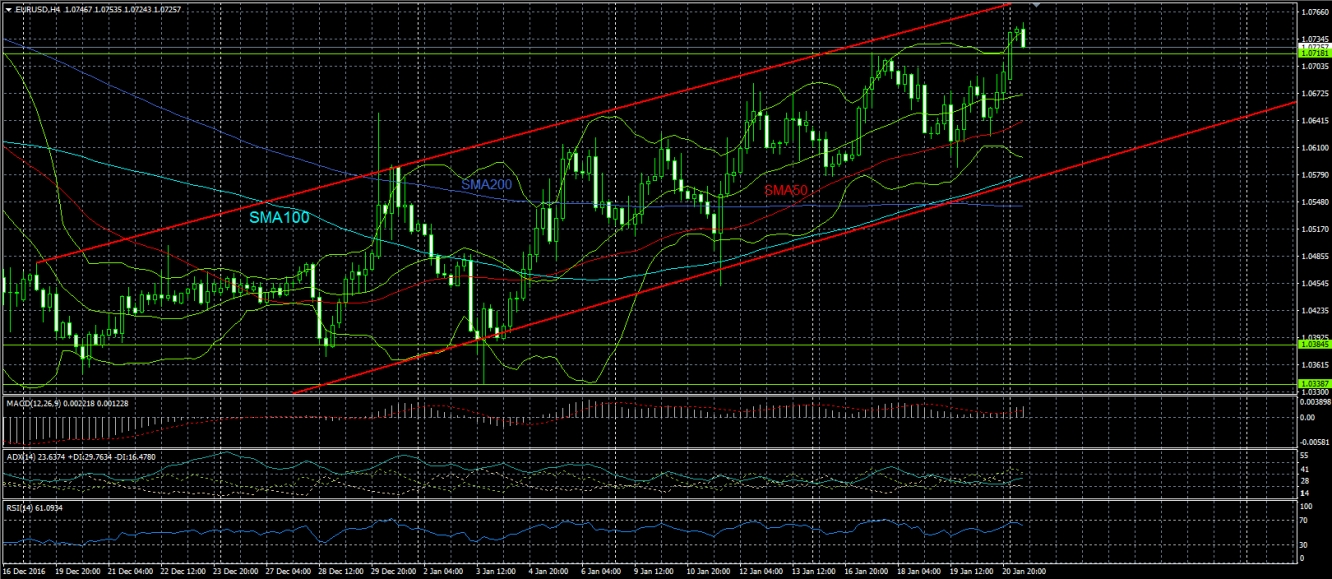
The main currency is trading within a rising channel since the end of December on the 4-hour chart. The pair just reached a new high touching the Bollinger’s® upper band while MACD and RSI are on bullish territories but are both slopping down. The overall medium-term sentiment is bullish with indications for a short term correction to the downside targeting the SMA50. The nearest support levels are 1.065 and 1.06 and the resistances are 1.075 and the psychological level of 1.08. 
GBP/USD
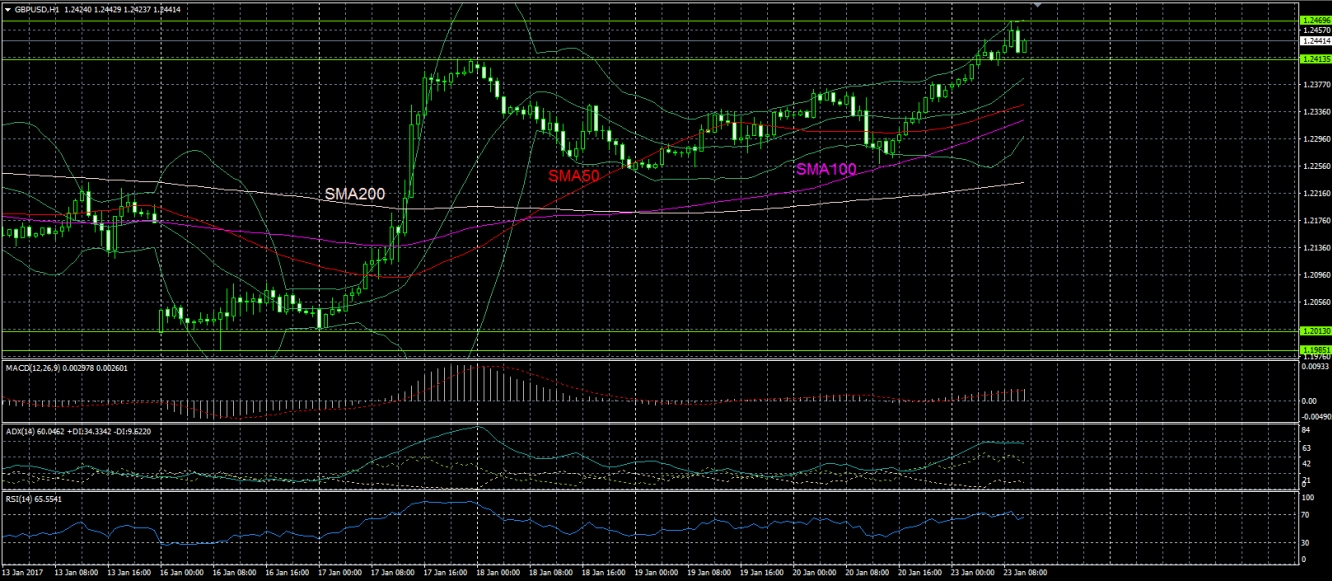
The short term outlook on the Cable is bullish as well, with pound reaching the level of 1.247 and the momentum indicators slopping upwards. The pair is also trading above the triple SMAs and is walking on Bollinger’s upper band at the time of writing. A possible pullback down to 1.242 is on the cards since ADX indicates overextended positive directional movement. However, tomorrow’s Supreme Court statement is expected to cause short-term volatility to the pair. The valid support levels are near 1.242 and 1.235 while the resistances are the price levels of 1.25 and 1.256.
USD/CHF
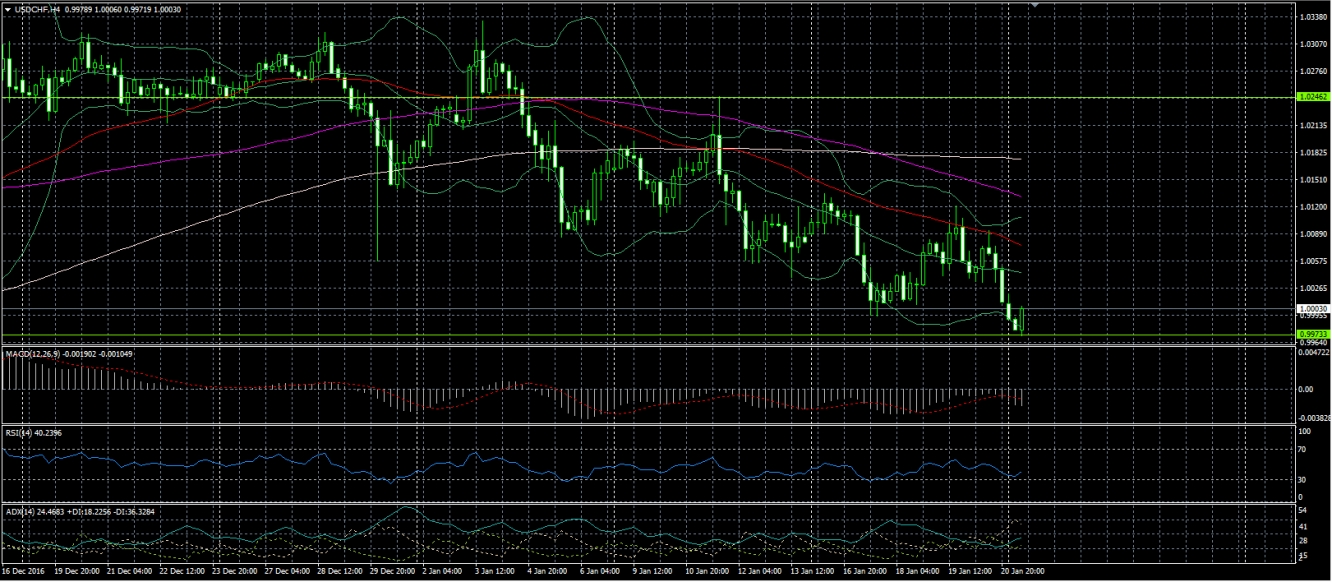
USD/CHF is trading within a falling channel and below the triple SMAs on the 4-hour chart. The pair has just touched Bollinger’s lower band at the time of writing. Moreover, RSI and MACD are on bearish territories but they are both slopping upwards, indicating a possible upside correction to the medium-term downtrend. ADX also confirms the overall downtrend picture since it indicates negative direction. The valid support levels are near the critical price of parity and then at 0.995 while the resistances are near the psychological levels of 1.005 and 1.01.
Disclaimer: This material is provided as a general marketing communication for information purposes only and does not constitute an independent investment research. Nothing in this communication contains, or should be considered as containing, an investment advice or an investment recommendation or a solicitation for the purpose of buying or selling of any financial instrument. Users acknowledge that any investment in FX and CFDs products is characterized by a certain degree of uncertainty and that any investment of this nature involves a high level of risk for which the users are solely responsible and liable. We assume no liability for any loss arising from any investment made based on the information provided in this communication. This communication must not be reproduced or further distributed without our prior written permission.
