Numerous stock return patterns correlate to the annual calendar and make headlines every few months—think of the "Santa Rally" or "January Effect." Most investors are likely to have also heard the market adage "Sell in May and Go Away."
Proponents of this seasonal strategy suggest that equity returns tend to be higher during the November-April period than between May and October. The thinking is that as warmer weather sets in, market participants will go away on holiday which means trading volumes decrease. Thus stock prices could simply drift, without much sense of direction.
Academic research led by Sandro C. Andrade of the University of Miami, Coral Gables, Florida, suggests:
“Reducing equity exposure starting in May and levering it up starting in November persists as a profitable market timing strategy. On average, stock returns are about 10 percentage points higher in November-April half-year periods than in May-October half-year periods. We also find the Sell in May effect is pervasive in financial markets.”
On the other hand, another study by Hubert Dichtl of alpha portfolio advisors GmbH and Wolfgang Drobetz of the University of Hamburg, Germany, suggests this seasonal effect has “strongly weakened or even diminished in recent years.”
Actual market data, especially from recent years, is also mixed. However, for those investors who are considering selling their equity holdings this May, there might be other asset classes of interest. Therefore, today’s article introduces such assets—Exchange-Traded Funds (ETFs).
First Trust Multi-Asset Diversified Income Index Fund
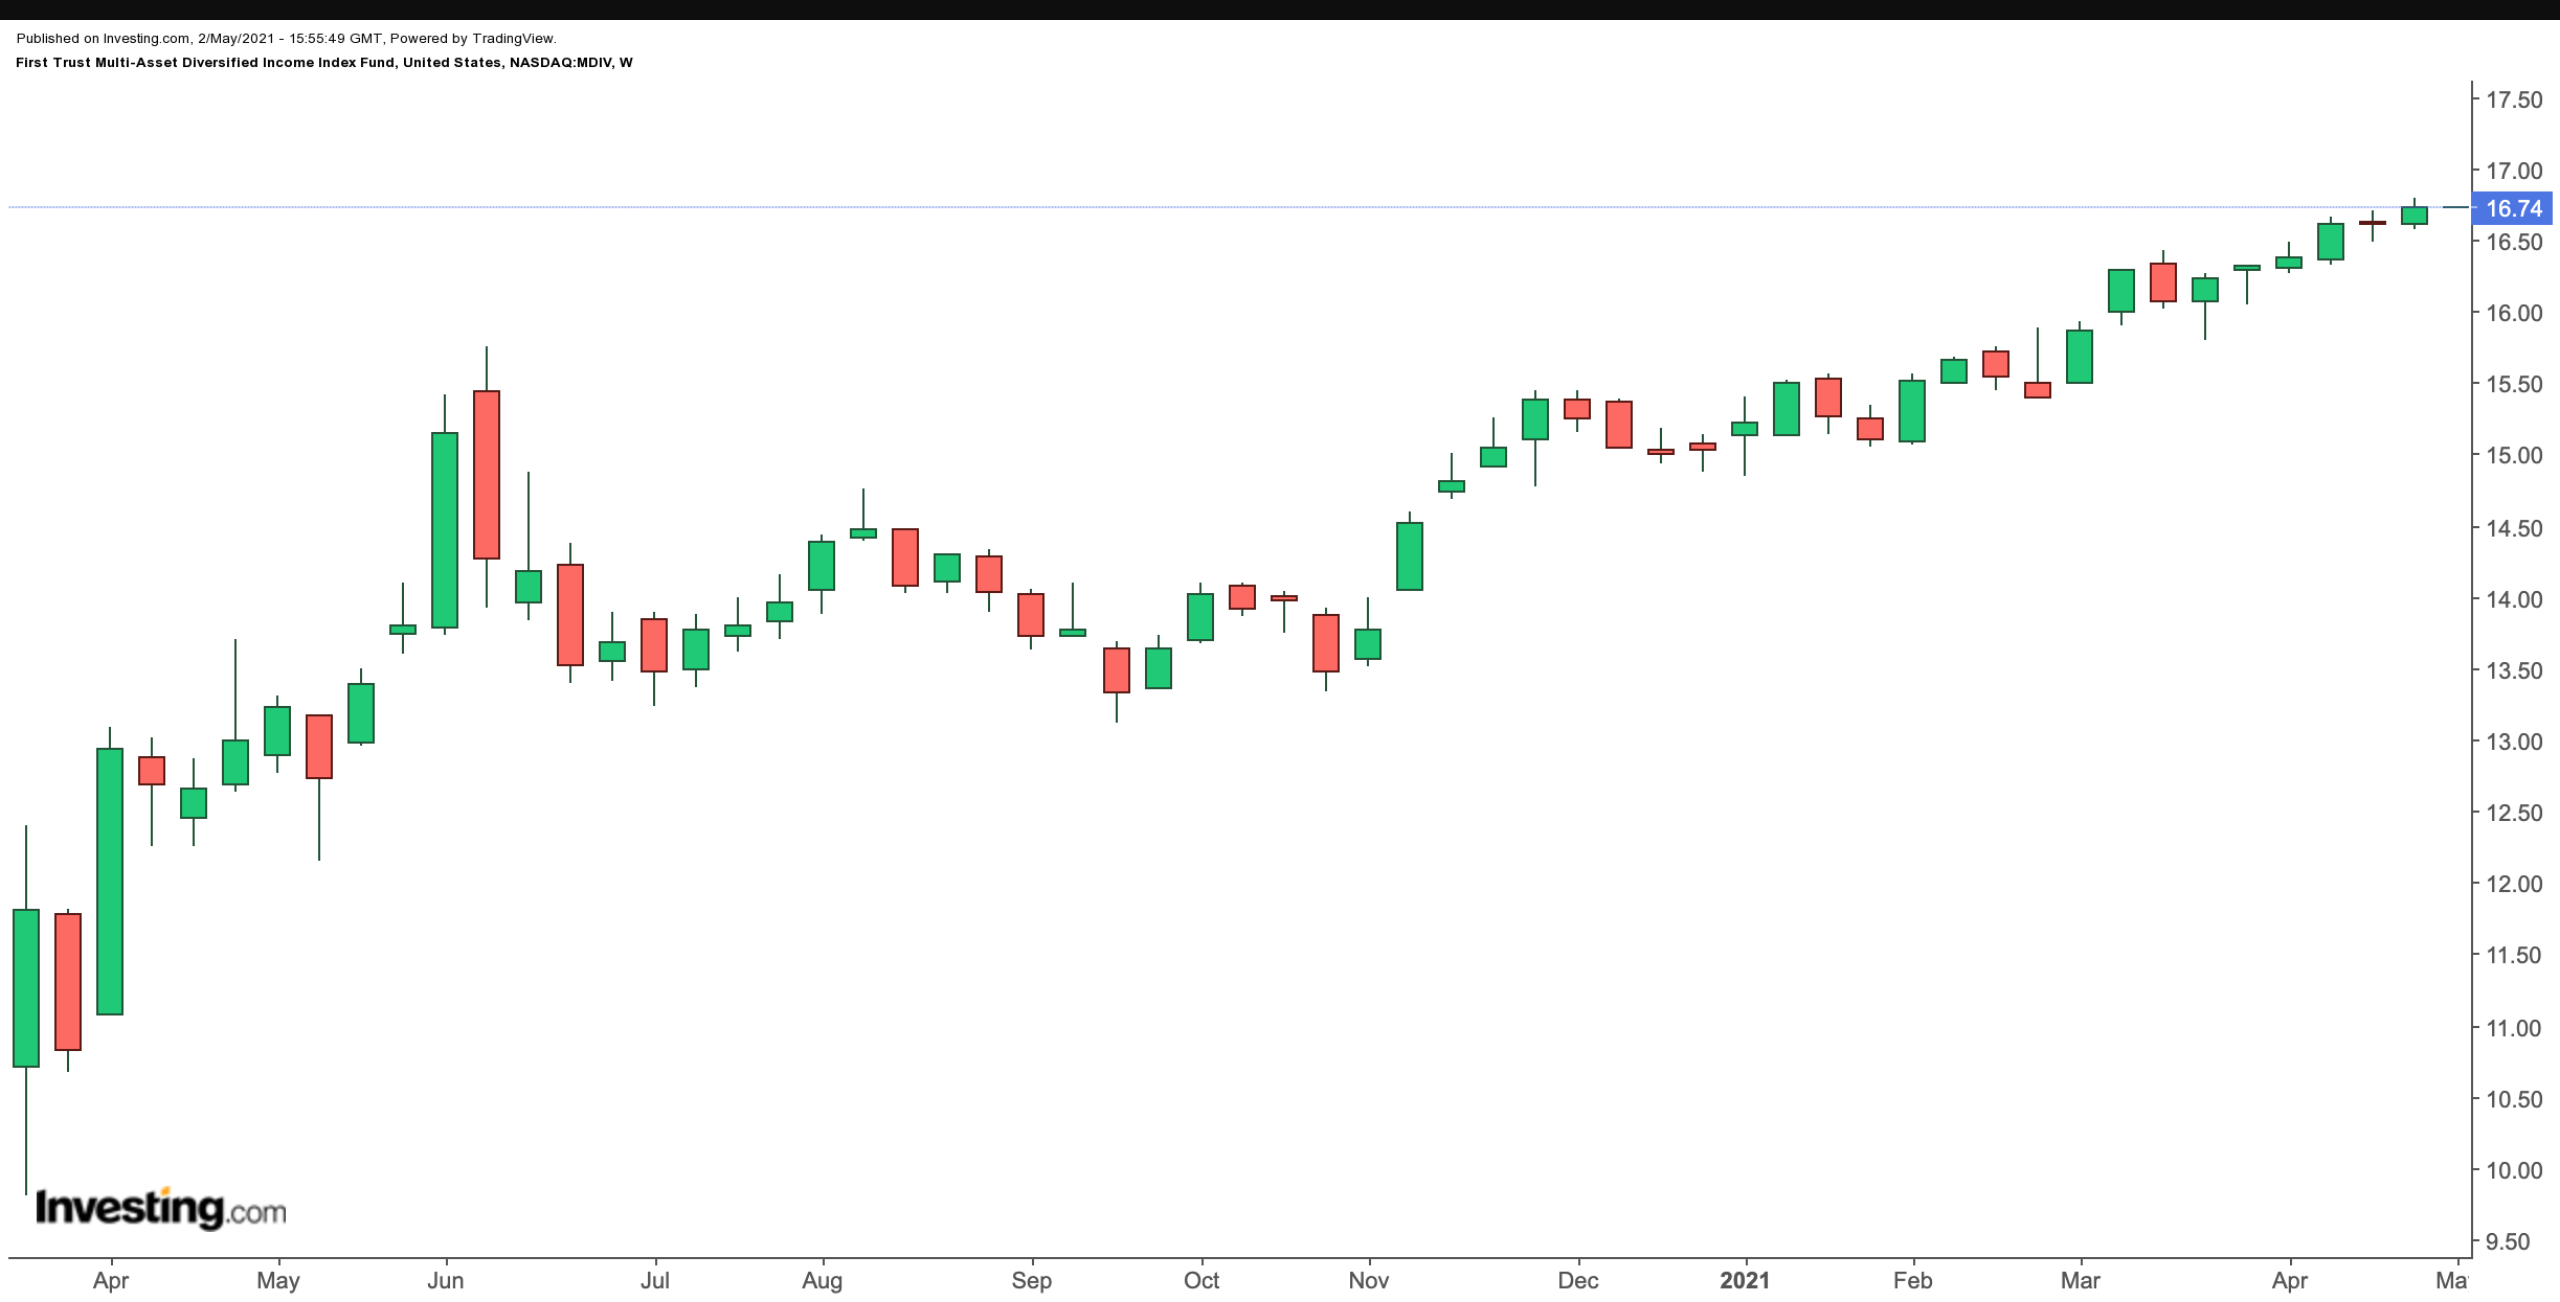
- Current Price: $16.74
- 52-Week Range: 12.15-16.83
- Dividend Yield: 4.97%
- Expense Ratio: 0.68%
The ETF space is evolving and growing. As a result, investors who want to decrease exposure to equities, could consider buying an ETF that provides exposure to several asset classes within a single fund.
Within such funds, asset classes typically include bonds (government and/or corporate), stocks (mostly dividend-paying shares), preferred securities (or "hybrids" that share the characteristics of both stocks and bonds), master limited partnerships (MLPs which typically distribute over 70% of their cash flow to investors) and real estate investment trusts (REITs) which focus on income-producing real estate.
The First Trust Multi-Asset Diversified Income Index Fund (NASDAQ:MDIV) is an ETF that follows such a multi-asset strategy. MDIV began trading in August 2012, and net assets stand at $486 million.

The fund tracks the NASDAQ US Multi-Asset Diversified Income Index, which only invests in US-listed assets. This index is rebalanced quarterly. MDIV currently has 124 holdings. Its composition is as follows: Dividend-Paying Equities (22.68%), REITs (20.95%), MLPs (19.17%), High Yield Corporate Bond ETFs (18.88), and Preferred Securities (17.47%).
Fund managers employ additional eligibility criteria for each asset class in the fund. Understandably, each type of asset has its unique risks and rewards. But the asset allocation is almost equally distributed among these different sectors. As a result, the fund could prove appropriate for different phases of the economic cycle.
Potential investors should also note that the First Trust Tactical High Yield ETF (NASDAQ:HYLS) makes up 18.80% of MDIV. HYLS, which has nearly $2.3 billion in assets, invests at least 80% of its net assets in high yield debt securities rated below investment grade, i.e., junk bonds that come with credit risk. The fund's main objective is to provide current income.
In an environment where interest rates are close to zero, funds that specialize in junk bonds typically get significant attention. Year-to-date (YTD), HYLS is down about 0.25%. But its current yield is over 5%.
Going back to MDIV, no other security in the fund has more than 1.70% in weighting. Other holdings include the real estate investment trust Starwood Property Trust (NYSE:STWD), mortgage REIT Annaly Capital Management (NYSE:NLY), and the healthcare facility REIT National Health Investors (NYSE:NHI).
YTD, MDIV returned over 11% and saw a 52-week high on Apr. 30. Investors wishing to allocate some of their assets to a diverse range of income-generating sectors should keep this fund on their radar.
We would look to buy the dips, especially if there is a decline toward $16.5 or below. The diversification and the current dividend yield would likely appeal to a range of individuals, such as retirees.
