
Most major EU and US indices closed in the green yesterday, with Wall Street hitting fresh record highs after both the US retail sales for March and initial jobless claims beat market estimates. This suggests that investors give the Fed the benefit of the doubt that any spikes in inflation this year are likely to prove to be temporary and extra-loose monetary policy will stay in place for the years to come.
Retail Sales And Jobless Claims Support Investor Morale
The US dollar continued trading lower against the majority of the other G10 currencies. It lost the most ground against AUD, NZD, and SEK, while it eked out some gains only versus CAD, EUR and GBP.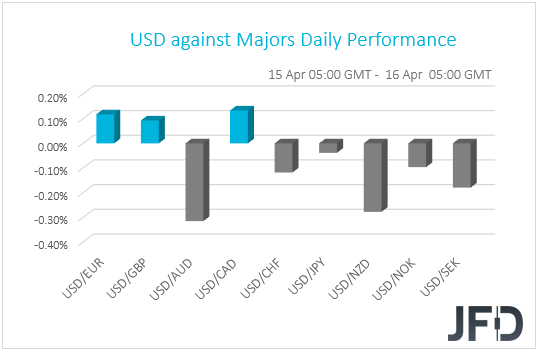
The weakening of the US dollar, combined with the strengthening of the risk-linked Aussie and Kiwi, suggests that markets traded in a risk-on manner yesterday and today in Asia. Indeed, shifting our attention to the equity world, we see that most major EU and US indices closed in positive territory, with all three of Wall Street’s main indices hitting fresh record highs. The exceptions were Italy’s FTSE MIB and Spain’s IBEX 35. The positive appetite rolled over into the Asian session today as well.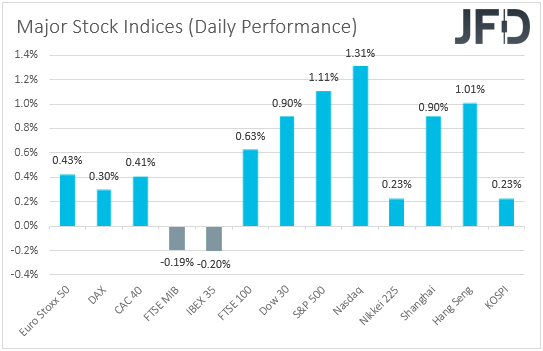
Yesterday, market participants turned their focus to the US economic data, with retail sales for March rebounding 9.8% mom, the biggest increase since May 2020, exceeding the consensus of 5.9%. February’s print was also revised higher, to -2.7% mom from -3.0%. Initial jobless claims were also much better than expected. The Labor Department said that new claims for unemployment benefits fell from 769k to 576k, the lowest level since mid-March 2020, beating market expectations for a slide to 700k. Despite the big decrease, the figure remains well above its pre-pandemic levels, perhaps as the enhancement of the unemployment-benefit programs encouraged more people to file for aid, and perhaps gave a reason for some not to seek for a job.
In any case, equities reacted positively to the results, confirming our view that investors will cheer the signs of a fast economic recovery in the US, and that they are unlikely to begin worrying about inflation again. It seems that despite the US headline CPI rate jumping to +2.6% yoy in March, market participants give the Fed the benefit of the doubt that any spikes in inflation this year are likely to prove to be temporary and extra-loose monetary policy will stay in place for the years to come.
With that in mind, we would expect equities and other risk-linked assets to continue drifting north, while safe-havens, like the yen, may stay under selling interest. The US dollar may continue to slide as well on signs that the Fed is not in a hurry to start discussing policy normalization.
NASDAQ 100 Technical Outlook
The NASDAQ 100 cash index traded north yesterday, hitting a new all-time high at 14039.90. Overall, the index is trading above the upside support line drawn from the low of Mar. 25, and well above another upside line taken from the low of Mar. 5. In our view, these technical signs paint a very positive picture.
Bearing in mind that the index pulled back after hitting its new record, we see decent chances for the setback to continue for a while more, perhaps for investors to challenge once again the Wednesday’s low of 13775. That said, as long as the price would stay above the upside line drawn from the low of Mar. 25, we would see decent chances for a rebound from that zone and another test near the all-time high of 14039.90. If they manage to overcome that level this time around, the index will be placed into uncharted territory.
Now, in order to start examining the case for a deeper correction to the downside, we would like to see a strong dip below 13655, which is the low of Apr. 9. This will also take the index below the upside line taken from the low of Mar. 25 and may initially target the low of Apr. 7, at around 13520. Another break, below 13520 could extend the slide towards the inside swing high of Apr. 2, at 13402, or the inside swing high of Mar. 16, at 13295.
AUD/JPY Technical Outlook
AUD/JPY traded in a consolidative manner yesterday, staying slightly below the 84.46 hurdle, which provide strong resistance between Mar. 31 and Apr. 6. Although the rate is trading above the tentative upside support line taken from the low of Mar. 24, we would like to see a clear break above 84.46 before we get confident on more advances. For now, we will stay cautiously positive.
A clear and decisive break above 84.46 will confirm a forthcoming higher high and may see scope for advances toward the 84.95 territory, defined as a resistance by the high of Feb. 25. If that barrier is not able to halt the rally, its break may allow extensions towards the peak of Mar. 18, at 85.44.
In order to abandon the bullish case, we would like to see a break below 83.47. This may also take the rate below the aforementioned upside line and could initially pave the way towards the 83.03 area, which acted as a support on Apr. 9 and 13. If the bears are willing to push the battle lower, then we may see them targeting the 82.55 zone, marked by an intraday swing low formed on Mar. 25.
As For Today's Events
Today, we get Eurozone’s final CPIs for March, which are expected to confirm their preliminary estimates, as well as the US building permits and housing starts for March, which are forecast to have risen somewhat. The preliminary UoM consumer sentiment index for April is also coming out and the forecast points to a rise to 88.9 from 84.9.