
Summary:
- The stock market fell last week, with the S&P 500 (SPX) down 127 points to 2633, a decline of 4.6%.
- Volatility rose as trade tensions between the US and China flared, this time related to the arrest of a Chinese corporate leader.
- Our projection this week is for stocks to decline to a support zone between 2620-2630 and then bounce to higher levels.
The stock market saw its widest swings since February, as early jubilation over the potential pause in trade tensions reverted back to high anxiety, as I pointed out in the latest Market Week show.
Last week started with a significant rally, after US and Chinese leaders met on the sidelines of the G20 meeting in Argentina. This was based on hopes that a 90-day delay in tariff implementation and continued trade talks would lead to positive outcomes.
However, optimism faded as awareness spread that Canadian officials had arrested the CFO of Chinese tech giant Huawei Technology Co Ltd (SZ:002502). This was done in conjunction with an investigation by the US Department of Justice over violations of Iran sanctions.
President Trump later tweeted, “More China talks are going very well!”
He said this after stocks had lost all of Monday’s gains, plus more. It was part of an attempt to assure the markets that the Huawei news would not impact the trade negotiations. But it didn’t work, with the S&P 500 losing another 2% on Friday.
In the midst of all of this, OPEC agreed to cut oil production by 1.2 million barrels per day. Yet this had only a modest impact on prices. As well, Qatar announced it was leaving the cartel, supposedly to focus on developing its natural gas industry.
Finally, the short end of the yield curve inverted, meaning that the interest rates for 2-year US treasury bills rose above those for the 5-year bill. The spread between the 2-year and 10-year notes also tightened. This is a reliable indicator that a recession may occur within 6-18 months.
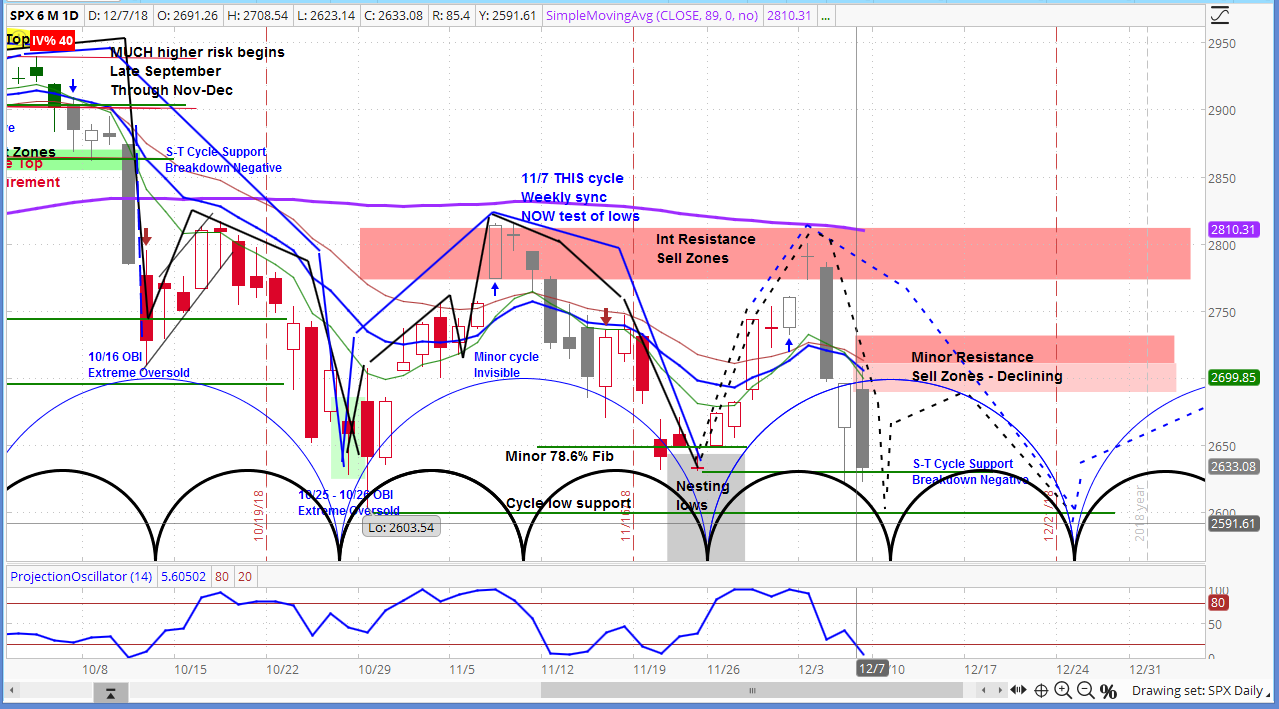
Our approach to technical analysis uses market cycles to project price action. Our analysis of the S&P 500 this week is for stocks to decline to a support zone between 2620-2630 and then bounce to higher levels.
We expect it to rise to a resistance zone between 2688 and 2710, as depicted on the chart above. This is a lower than the previous resistance zone, which implies the market will reach lower highs for the next minor cycle. This of course would be a bearish indicator for future price action.