Value Investors tend to follow the market in search for stocks which may seem somewhat undervalued when compared to their peers, industry and market in general. Fundamental Analysis, Valuation Metrics and overall looking into a company's books are all used when trying to identify the best investment option. On this occasion, we will analyze three credit card giants: Visa, MasterCard and American Express.
Let's begin with Visa Inc Class A (NYSE:V), by far the largest network by cardholders in the world, with a market cap of $389.9 billion. As of Friday's closing price, the stock holds a PE 33.4x, PEG 2.7x, PS 17.5 and PB 12.8x. It also holds an Intrinsic Value based on Future Cash Flows of $160.28. Now, this value is important because it forecasts future cash flows of a company's business discounting them to today's value. So, having in mind the stock's current price, it is 8% overvalued based on this metric.

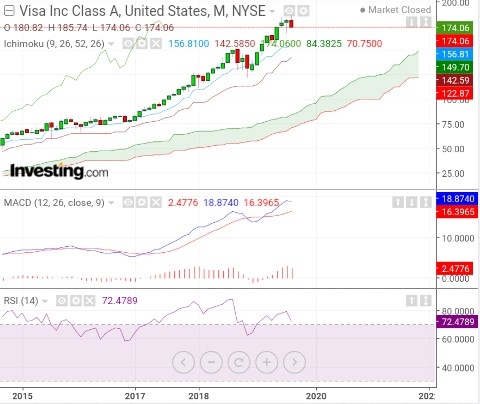
Above we have Visa's monthly Chart where, besides it's sustained growth over the years, we can see a double top at the $180.60 level. This might be sending a message to investors that a top might of been reached. The stock continues having buy signals by MACD and Ichimoku which is good, but the RSI does show us the stock is currently overbought.
Now let's take a look at Mastercard Inc (NYSE:MA), which has a market cap of $275.1 billion. After yesterday's close, the stock holds a PE 41.6x PEG 2.9x PS 17.5x and PB 55x. It's Intrinsic Value based on Future Cash Flows is $233.17, currently trading 16% overvalued.

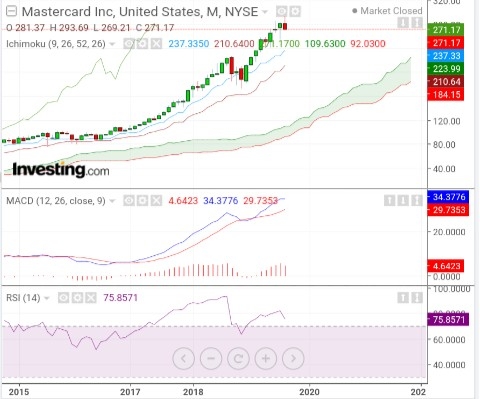
Taking a look at MasterCard's monthly chart, it is very similar to Visa's. Stock is forming a double top at $281.10 and also continues having buy signals by MACD and Ichimoku. It's RSI also shows the stock is currently overbought.
Last but not least, we have American Express Company (NYSE:AXP), one of America's favorite credit card with a market cap of $96.9 billion. After Friday's close, the stock has a PE 14.4x, PEG 2.1x, PS 2.5x and PB 4.2x. It's Intrinsic Value based on Future Cash Flows is $141.85 which means the stock is currently trading at a 21% discount from it's fair price based on this metric.

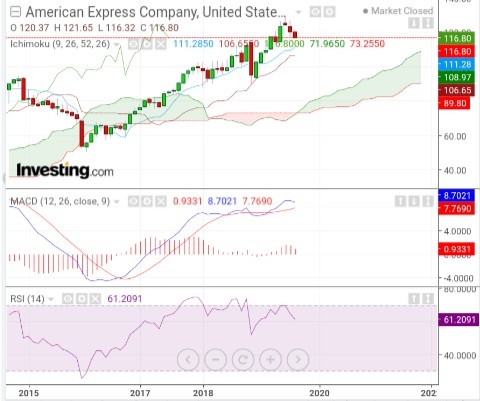
AmEx's monthly chart differs from the other two primarily because it's RSI is currently not in overbought zone.
Comparison and Conclusion
When comparing the valuation metrics used for these stocks, we clearly see AmEx is undervalued compared to Visa and MasterCard.
Another great item to have in mind is the 1-year EPS Forecast for these stocks, where Visa's is $6.26, MasterCard's is $9.02 and AmEx's is $8.99. This is important because we can also note that AmEx's earnings forecast is almost the same as MasterCard's having in mind it's market cap is practically 1/3 of MasterCard's.
If we add Dividend Yield into the mix, American Express also looks more attractive than the other two. Visa currently holds a dividend yield of 0.6%, MasterCard 0.5% and American Express 1.3%. The difference isn't so big but it still adds more credit to American Express.
