
Risk Appetite was supported once again during the Asian morning today, perhaps due to more signs that the coronavirus spreading may be leveling off, as well as due China’s better-than-expected trade data. Although further slowdown in the pandemic’s spreading may keep sentiment supported, we are still reluctant to trust a long-lasting recovery, and we prefer to take things day by day.
ASIAN EQUITIES GAIN ON VIRUS SLOWDOWN AND CHINA’S TRADE DATA
The dollar traded lower against all but two of the other G10 currencies on Monday and during the Asian morning Tuesday. The main gainers were AUD, NZD and GBP in that order, while the only losers were NOK and SEK. The greenback lost the least ground against EUR, CHF and JPY.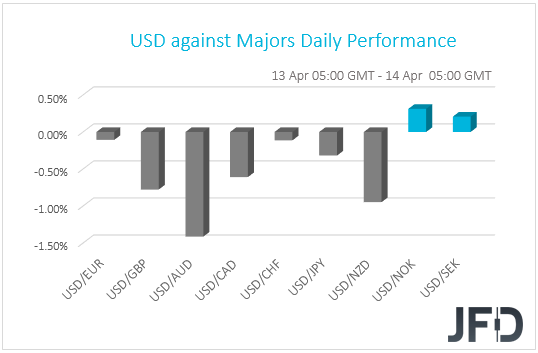
The strengthening of the risk-linked Aussie and Kiwi, as well as the relative weakness of the dollar, the yen and the franc, suggest that risk appetite was once again supported. Shifting attention to the equity world though, we see that both the Dow Jones and the S&P 500 closed in negative waters. This may have been on expectations of a very bad earnings season. JPMorgan (NYSE:JPM) and Wells Fargo (NYSE:WFC) start the season today. Only Nasdaq gained somewhat, aided by a 6.2% gain in Amazon (NASDAQ:AMZN). EU markets were closed in celebration of the Easter Monday. During the Asian session today, investors’ morale was more upbeat, with Japan’s Nikkei and China’s Shanghai Composite gaining 3.08% and 1.31%.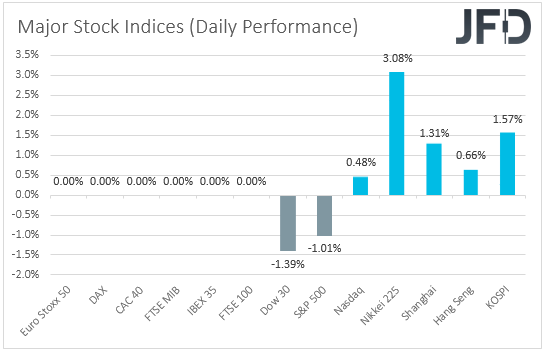
The rebound in market participants’ appetite during the Asian trading today may have been driven by more signs that the coronavirus spreading may be leveling off, as well as by China’s better-than-expected trade data. With regards to the virus, infected cases continued to slow on Monday, while the number of deaths was more or less equal to Sunday’s. As far as the Chinese data are concerned, both exports and imports fell by much less than expected, and also at a slower pace than in February, with the nation’s USD 7.09bn deficit turning into a USD 18.55bn surplus.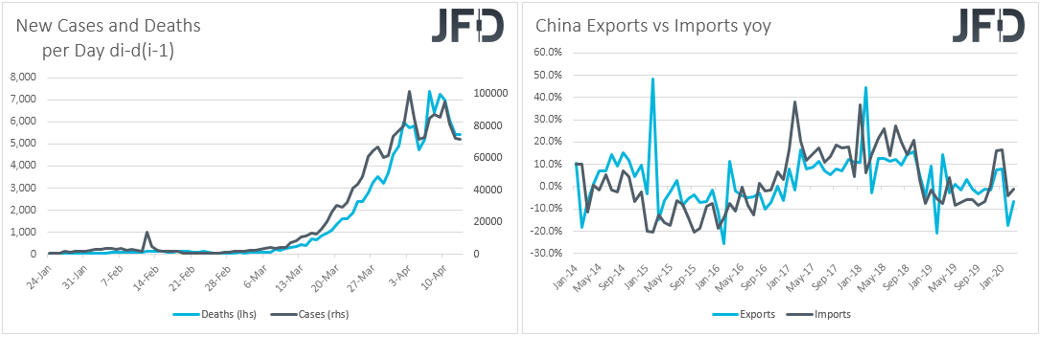
As for our view, as long as the virus numbers continue to point to a slowdown, equities and risk-linked assets may continue to gain on expectations that the restrictive measures around the globe may be lifted soon. Among currency pairs, the one that could perform better may be AUD/JPY. Apart from being supported due to the relatively upbeat investor morale, the Aussie may continue benefiting from the RBA’s stance with regards to monetary policy. Remember that this Bank appears unwilling to cut interest rates further, while last week, it noted that if conditions continue to improve, it may start scaling back its QE soon. As for the yen, it is well known that during periods of market optimism, it comes under selling interest.
Having said all that though, we are still reluctant to trust a long-lasting recovery in the broader market sentiment. We prefer to take things day by day. Just a day of new records in infected cases and deaths may be enough to revive fears and spark another round of risk aversion. On top of that, we believe that even if we have reached the peak of the outbreak, removing the restrictive measures and reopening economies around the globe may be a very slow procedure, as governments may want to make sure that the virus has indeed been contained.
NIKKEI 225 – TECHNICAL OUTLOOK
This morning, we are seeing that Nikkei 225 is flirting with its key resistance barrier, at 19633, which marks the highs of March 25th and April 5th. If, eventually, the index moves strongly above that barrier and stays above it, this could invite more bulls into the arena. In addition to that, as long as the price continues to balance above its short-term tentative upside support line drawn from the low of March 22nd, there is a good chance Nikkei 225 might stay attractive for some buyers. For now, we will remain positive with the near-term outlook.
As mentioned above, if the index makes a decent move above the 19633 barrier, this may increase its chances of moving further north, possibly targeting the 20190 zone, which is the high of March 10th. The price may get a hold-up there, however, if the buying interest remains strong, a further push north could bring the index to the 20743 level, marked by an inside swing low of March 3rd and near an intraday swing high of March 6th.
Alternatively, if the index reverses sharply, breaks the aforementioned upside line and falls below the 18723 hurdle, which is the low of April 8th, this could spook the bulls from the field for some time and Nikkei 225 may end up drifting further south. That’s when we will aim for the 18291 obstacle, a break of which could clear the path to the 17533 level, marked by the current lowest point of April.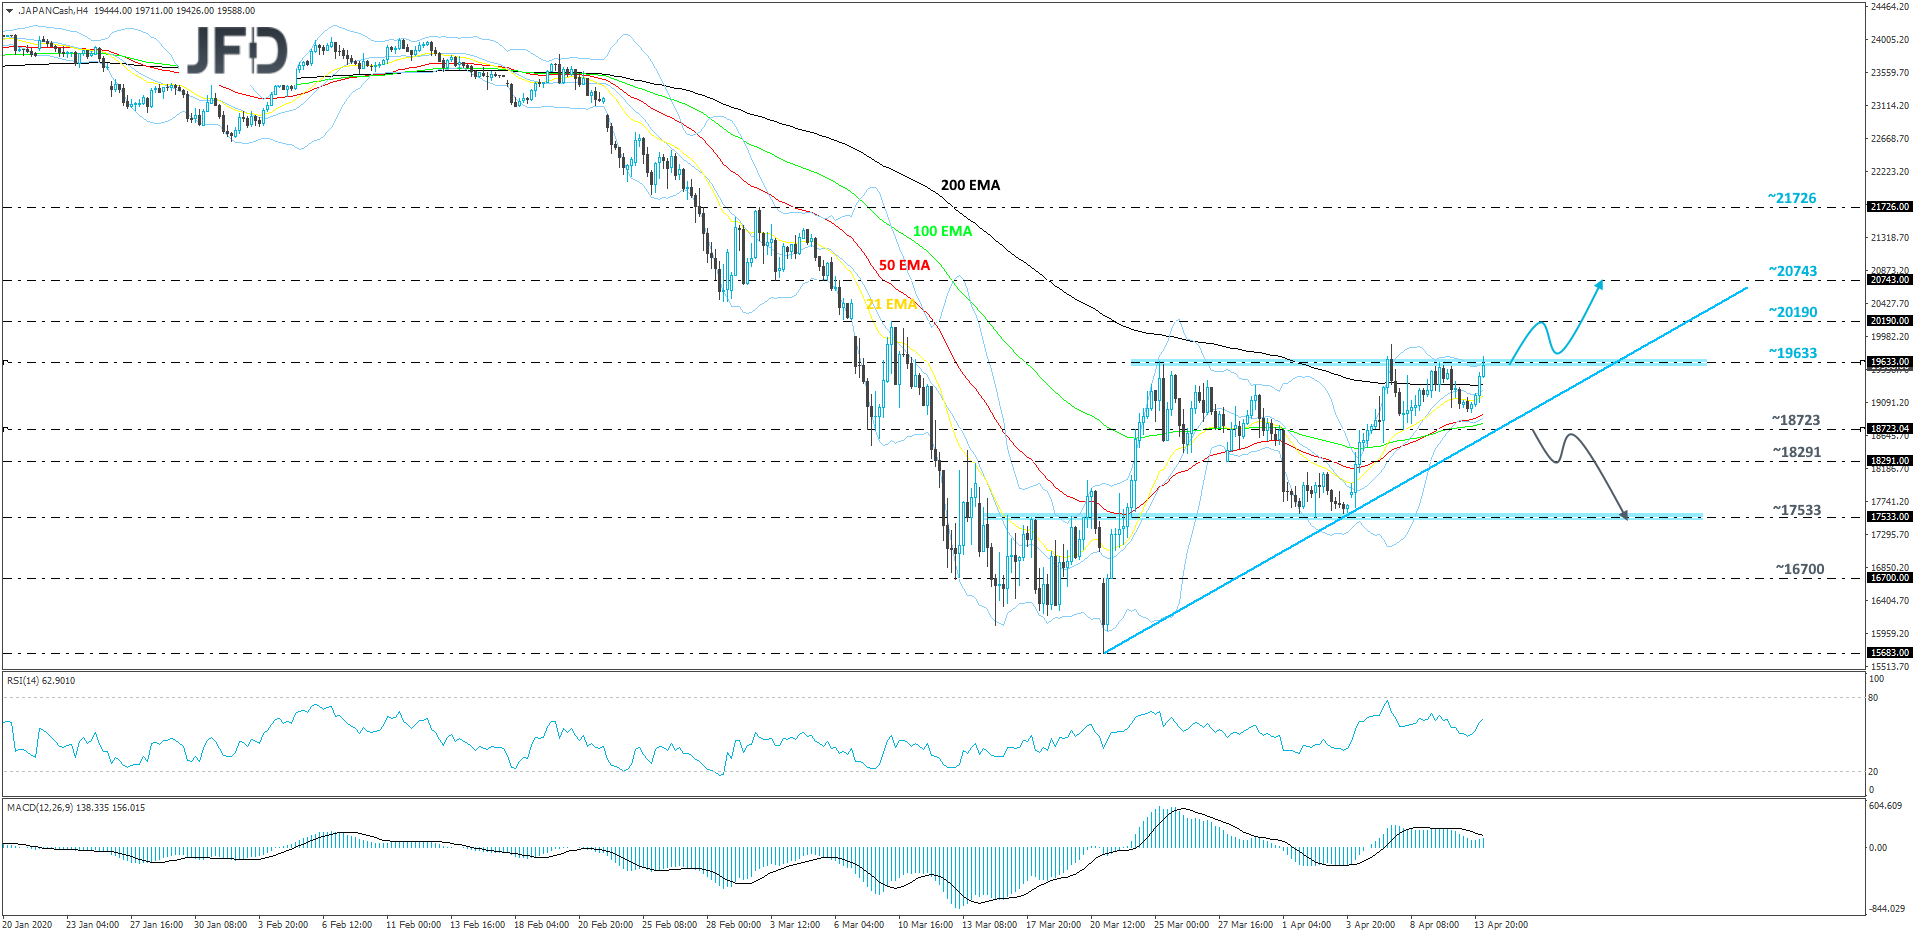
AUD/JPY – TECHNICAL OUTLOOK
AUD/JPY continues to slowly grind higher, while trading above a short-term upside support line taken from the low of March 19th. This morning, the pair also managed to break above its key resistance barrier, at 69.00, this way forming a higher high. As long as the rate remains above the above-discussed upside line, we will stick to the positive scenario.
If AUD/JPY gets pushed further north, the next potential resistance barrier it may end up testing could be near the 70.30 hurdle, which is marked by an inside swing low of March 3rd and near an intraday swing high of March 6th. The pair may stall around there for a bit, or even correct slightly lower and move closer to the aforementioned upside line. As mentioned previously, if that line stays intact, the bulls might take advantage of the lower rate and take charge again. Another push higher and a break above the 70.30 area would confirm another higher high and could clear the path to the 71.51 level, marked by the highest point of March.
In order to examine the downside, a break of the short-term upside support line and a rate-drop below the 67.74 hurdle would be needed. If such a move occurs, we will then target the 66.47 obstacle, a break of which could set the stage for a move to the next important support area, at 64.83, marked by the lows of April 1st and 3rd.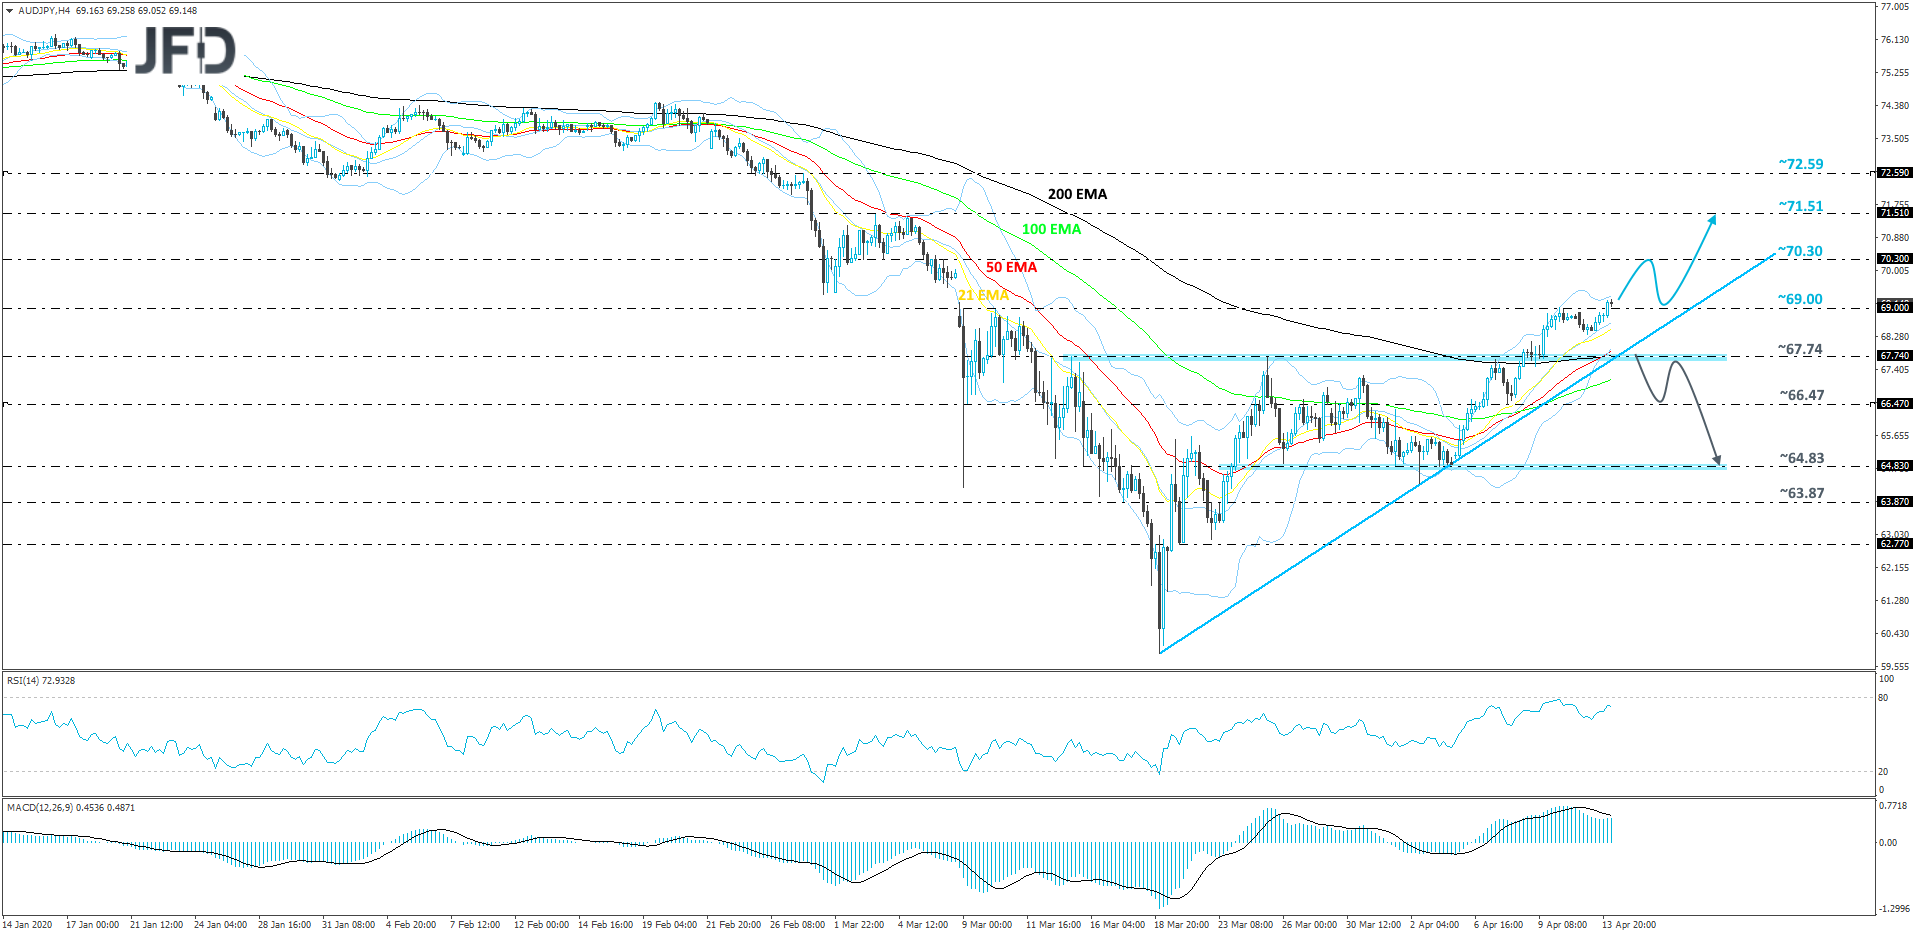
AS FOR THE REST OF TODAY’S EVENTS
The only releases worth mentioning on today’s calendar are the US NFIB small business optimism index for March and the API (American Petroleum Institute) weekly report on crude oil inventories. There is no forecast for those releases, but due to the pandemic fast-spreading in the US during March, we see the risks surrounding the NFIB index as tilted to the downside. Just for the record, February’s print was at 104.5.
- English (UK)
- English (India)
- English (Canada)
- English (Australia)
- English (South Africa)
- English (Philippines)
- English (Nigeria)
- Deutsch
- Español (España)
- Español (México)
- Français
- Italiano
- Nederlands
- Português (Portugal)
- Polski
- Português (Brasil)
- Русский
- Türkçe
- العربية
- Ελληνικά
- Svenska
- Suomi
- עברית
- 日本語
- 한국어
- 简体中文
- 繁體中文
- Bahasa Indonesia
- Bahasa Melayu
- ไทย
- Tiếng Việt
- हिंदी
Virus Slowdown And Chinese Trade Data Support Sentiment
Published 04/14/2020, 03:20 AM
Updated 07/09/2023, 06:31 AM
Virus Slowdown And Chinese Trade Data Support Sentiment
3rd party Ad. Not an offer or recommendation by Investing.com. See disclosure here or
remove ads
.
Latest comments
Install Our App
Risk Disclosure: Trading in financial instruments and/or cryptocurrencies involves high risks including the risk of losing some, or all, of your investment amount, and may not be suitable for all investors. Prices of cryptocurrencies are extremely volatile and may be affected by external factors such as financial, regulatory or political events. Trading on margin increases the financial risks.
Before deciding to trade in financial instrument or cryptocurrencies you should be fully informed of the risks and costs associated with trading the financial markets, carefully consider your investment objectives, level of experience, and risk appetite, and seek professional advice where needed.
Fusion Media would like to remind you that the data contained in this website is not necessarily real-time nor accurate. The data and prices on the website are not necessarily provided by any market or exchange, but may be provided by market makers, and so prices may not be accurate and may differ from the actual price at any given market, meaning prices are indicative and not appropriate for trading purposes. Fusion Media and any provider of the data contained in this website will not accept liability for any loss or damage as a result of your trading, or your reliance on the information contained within this website.
It is prohibited to use, store, reproduce, display, modify, transmit or distribute the data contained in this website without the explicit prior written permission of Fusion Media and/or the data provider. All intellectual property rights are reserved by the providers and/or the exchange providing the data contained in this website.
Fusion Media may be compensated by the advertisers that appear on the website, based on your interaction with the advertisements or advertisers.
© 2007-2024 - Fusion Media Limited. All Rights Reserved.