The main way a company can make more profit is to simply sell more stuff. But how do you sell more stuff?
You need cash.
Wall Street loves earnings and many people believe earnings drive cash to profitability, but the truth is that cash drives earnings. Cash is king and is the start and the end of a business.
No business can start without cash, and all businesses end in cash, whether it be liquidated or sold out.
This is why a business that can manage its cash efficiently will do better than its competitor.
In the cash conversion cycle, you start off with cash, it becomes inventory and accounts payable, which then becomes sales and accounts receivables before converting into cash again.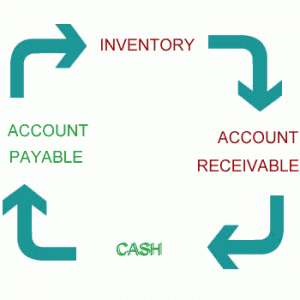
The entire cash conversion cycle is a measure of management effectiveness. The lower the better, and a great way to compare competitors.
The Cash Conversion Cycle Formula
Cash Conversion Cycle = Days Inventory Outstanding + Days Sales Outstanding – Days Payables Outstanding
Days Inventory Outstanding
Days Inventory Outstanding shows you in days, how long it takes for inventory to be sold. The quicker inventory is sold, the better.
DIO = (Inventory/COGS) x 365
This is an annual calculation. To calculate between two periods, use the below formula.
DIO = Average inventory/COGS x number of days in period
Average Inventory = (beginning inventory + ending inventory)/2
Days Sales Outstanding
Days Sales Outstanding is the number of days it takes for a company to collect money from sales and involves accounts receivables. Obviously, a low number is better.
DSO= (Accounts Receivables/Revenue) x 365
This is an annual calculation. To calculate between two periods, use the below formula.
DSO = Average AR / Revenue x number of days in period
Average AR= (beginning AR + ending AR)/2
Days Payables Outstanding
Days Payables Outstanding represents how many days before the company pays it off. The higher the number, the better, because that means the company can use that cash for other profitable purposes before making payments.
DPO = (Accounts Payable/COGS) x 365
This is an annual calculation. To calculate between two periods, use the below formula.
DPO = Average AP / COGS per day
Average AP = (beginning AP + ending AP)/2
Cash Conversion Cycle of Shoe Retailers
See the charts below comparing the cash conversion cycle for Sketchers (SKX), Deckers Outdoor (DECK), Crocs (CROX), Steve Madden (SHOO), and K-Swiss (KSWS). 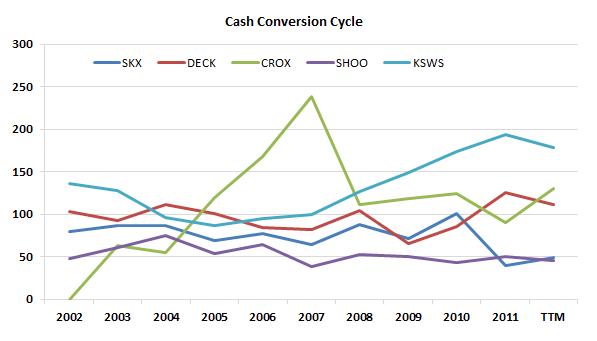
Since all these companies are involved in making and selling shoes, the cash conversion cycle is all above 50 days, but the company with the best and most consistent record is SHOO.
The worst offender of the bunch is currently K-Swiss. I wish somebody told me about the cash conversion cycle when I bought KSWS back in 2008 and 2009. It sure would have saved me a lot of money because their troubles have continued to escalate.
Here’s a chart that breaks down the cash conversion cycle of K-Swiss.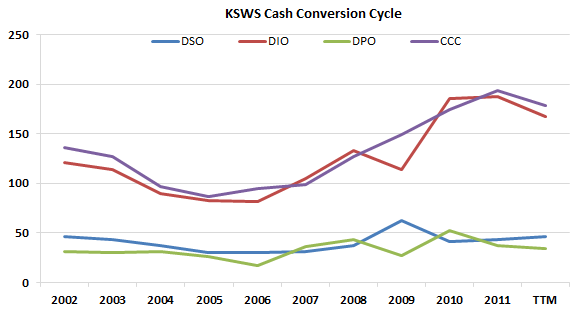
Although DSO and DPO has been fairly consistent, the increase in DIO should have been a huge warning sign.
The other interesting company to look at is Crocs. If you go and read up on Crocs, you will find out that they had some serious inventory issues in 2007 and the cash conversion cycle climbed vertically before they slashed inventory and got a handle on it again.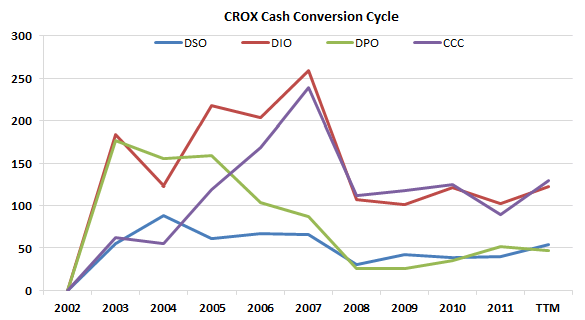
Now take a look at the next chart of this series below to see whether cash conversion cycles matters or not.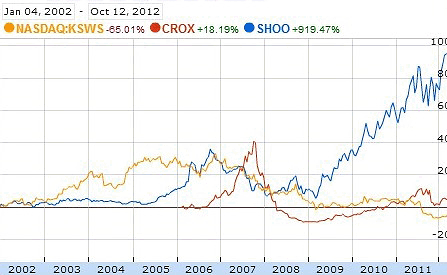
The stock price direction is not entirely dependent on the cash conversion cycle, but it certainly does have a factor and is something you should check regularly too.
- English (UK)
- English (India)
- English (Canada)
- English (Australia)
- English (South Africa)
- English (Philippines)
- English (Nigeria)
- Deutsch
- Español (España)
- Español (México)
- Français
- Italiano
- Nederlands
- Português (Portugal)
- Polski
- Português (Brasil)
- Русский
- Türkçe
- العربية
- Ελληνικά
- Svenska
- Suomi
- עברית
- 日本語
- 한국어
- 简体中文
- 繁體中文
- Bahasa Indonesia
- Bahasa Melayu
- ไทย
- Tiếng Việt
- हिंदी
Using The Cash Conversion Cycle To Help Pick Stocks
Published 10/22/2012, 08:00 AM
Updated 07/09/2023, 06:31 AM
Using The Cash Conversion Cycle To Help Pick Stocks
The Cash Conversion Cycle
3rd party Ad. Not an offer or recommendation by Investing.com. See disclosure here or
remove ads
.
Latest comments
Install Our App
Risk Disclosure: Trading in financial instruments and/or cryptocurrencies involves high risks including the risk of losing some, or all, of your investment amount, and may not be suitable for all investors. Prices of cryptocurrencies are extremely volatile and may be affected by external factors such as financial, regulatory or political events. Trading on margin increases the financial risks.
Before deciding to trade in financial instrument or cryptocurrencies you should be fully informed of the risks and costs associated with trading the financial markets, carefully consider your investment objectives, level of experience, and risk appetite, and seek professional advice where needed.
Fusion Media would like to remind you that the data contained in this website is not necessarily real-time nor accurate. The data and prices on the website are not necessarily provided by any market or exchange, but may be provided by market makers, and so prices may not be accurate and may differ from the actual price at any given market, meaning prices are indicative and not appropriate for trading purposes. Fusion Media and any provider of the data contained in this website will not accept liability for any loss or damage as a result of your trading, or your reliance on the information contained within this website.
It is prohibited to use, store, reproduce, display, modify, transmit or distribute the data contained in this website without the explicit prior written permission of Fusion Media and/or the data provider. All intellectual property rights are reserved by the providers and/or the exchange providing the data contained in this website.
Fusion Media may be compensated by the advertisers that appear on the website, based on your interaction with the advertisements or advertisers.
© 2007-2024 - Fusion Media Limited. All Rights Reserved.
