Bitcoin price today: steady near $87k after soft US CPI data, set for weekly loss
I do most of my charting at Stockcharts.com, but I spend most of my day using thinkorswim to monitor markets intraday. Thinkorswim is a great platform and is an excellent charting tool. One of my favorite thinkorswim studies is the Mesa Sine Wave indicator. We can use the sine wave to determine if the market is trending and it can help identify possible shifts in trend.
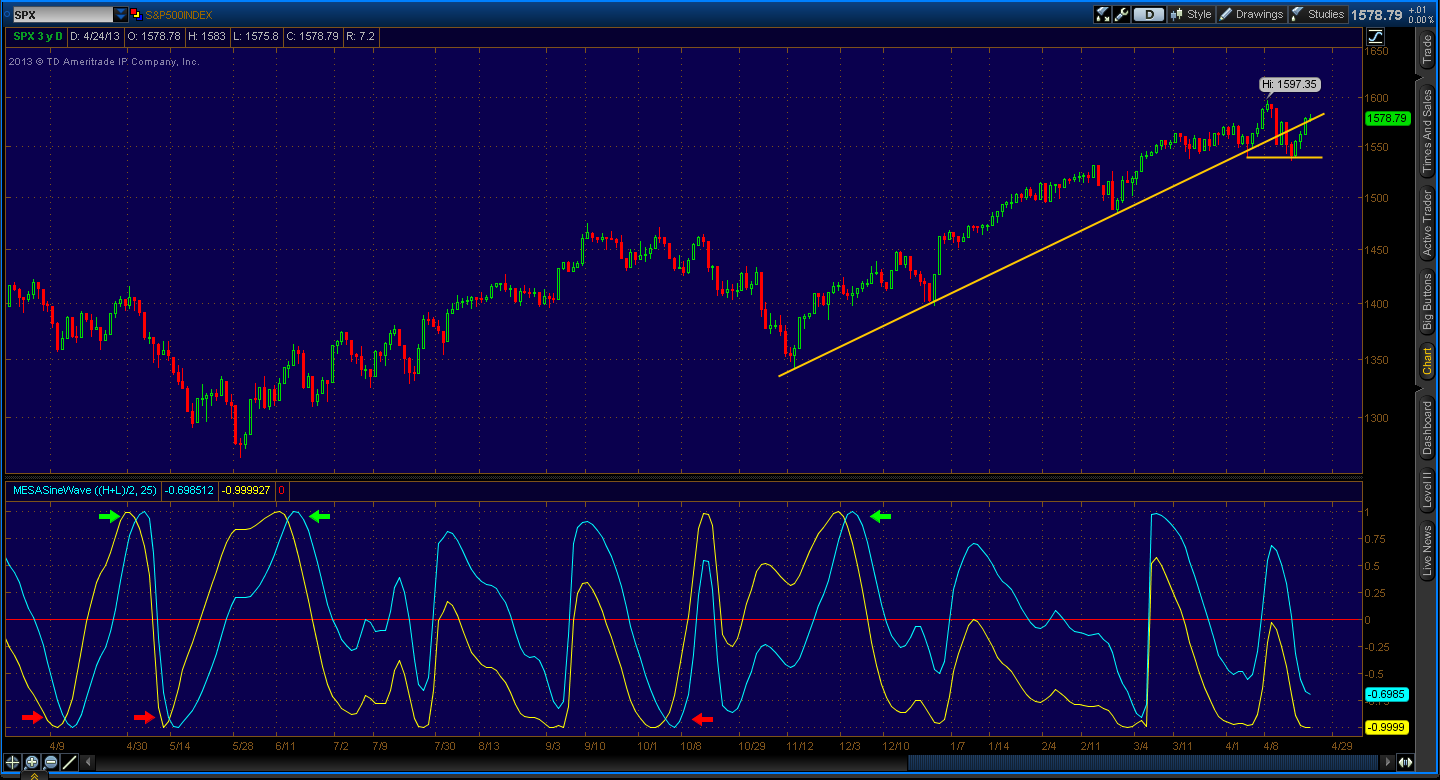
The Mesa Sine Wave indicator uses two sine waves, one ‘normal’ sine wave as well as a wave that’s advanced by a 45 degree angle, called the “lead wave.” We can see that when the sine wave crosses the lead wave, the security may be changing trend. I’ve put green and red arrows to show examples of crosses on the S&P 500 chart below. The sine wave has been above the lead wave since December 3rd of last year, staying with the up trend in SPX. Using the Mesa Sine Wave indicator is not going to provide perfect trending signals, nothing will. However it can be a great tool to help see trends on various time frames.
I’ve also noted the trend line that I discussed a few weeks ago in my "Technical Analysis Doesn’t Have to be Difficult" post. I identified the possible levels of support if we saw a trend line break in the large cap equity index. Sure enough, we saw weakness and tested the previous short-term low and bounced. We are now back above the rising trend line and it appears bulls are going to try to make a run for 1600.
The Mesa Sine Wave indicator uses two sine waves, one ‘normal’ sine wave as well as a wave that’s advanced by a 45 degree angle, called the “lead wave.” We can see that when the sine wave crosses the lead wave, the security may be changing trend. I’ve put green and red arrows to show examples of crosses on the S&P 500 chart below. The sine wave has been above the lead wave since December 3rd of last year, staying with the up trend in SPX. Using the Mesa Sine Wave indicator is not going to provide perfect trending signals, nothing will. However it can be a great tool to help see trends on various time frames.

I’ve also noted the trend line that I discussed a few weeks ago in my "Technical Analysis Doesn’t Have to be Difficult" post. I identified the possible levels of support if we saw a trend line break in the large cap equity index. Sure enough, we saw weakness and tested the previous short-term low and bounced. We are now back above the rising trend line and it appears bulls are going to try to make a run for 1600.
