After much publicity, the US administration announced $60bn of tariffs for Chinese goods. China were quick to respond with a 25% revenge-tax on US pork products (and 15% on US steel pipes, among others) yet chose to cap their retaliation at $3bn. We may be in the early stages of an all-out trade war, but it’s at least a little reassuring that China are taking the more cautious approach.
Still, it did little to soothe the risk-off sentiment which had been apparent throughout the US session and, with the first steps of a trade war now in place, we await the reaction from European and US trading floors.

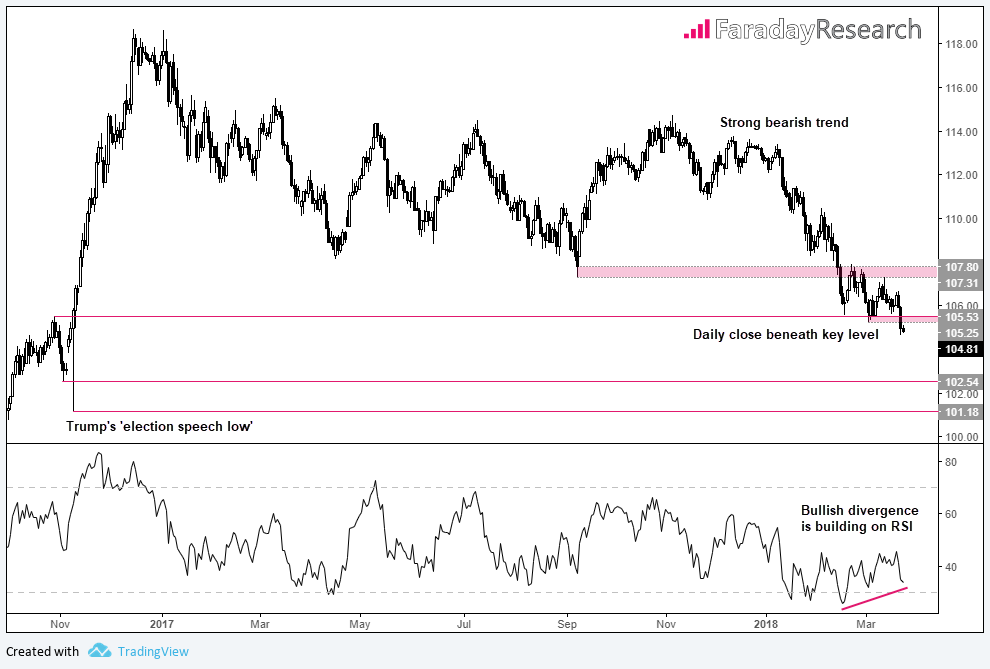
The Japanese yen and Swiss franc remained the favoured currencies today and it is interesting to note that USD/JPY made little effort to reclaim the 105 handle after effortlessly breaking beneath it yesterday. The daily trend structure is firmly bearish and the close confirmation below 105.25 suggests the trend could extend further.
In a previous USD/JPY post we highlighted that Trump’s ‘election speech low’ could come into focus again and yesterday’s break lower does just that. At the time of writing we are just over 200 pips above 101.18 and the daily ATR of 80 pips makes it feel closer.

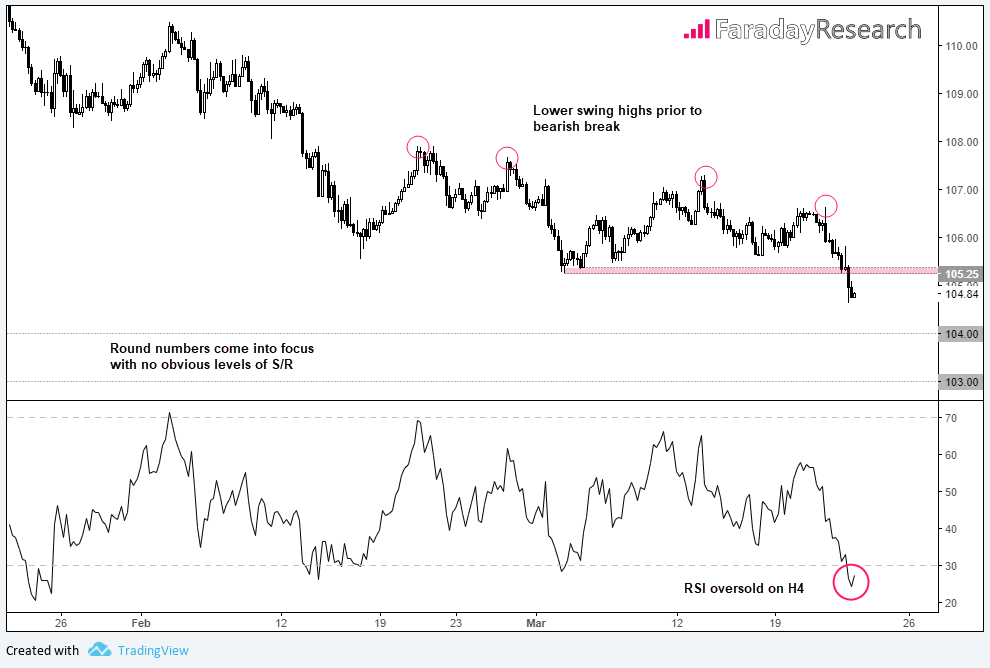
Zooming into the four-hour chart we can see the initial break beneath 105.25 was swift. Furthermore, prior to the breakout we saw a succession of lower highs to show bearish interest was slowly building above key support. And with no obvious layers of potential support nearby, 104 and 103 come into focus as possible targets.
However, as RSI is firmly oversold we’re conscious that the downside is at risk of becoming over-extended over the near-term. Therefore we’d prefer to see evidence of compression or a retracement before committing to a short.
As broken support can act as resistance, 105.25 is a level to watch if we trade higher from here. A clear rejection of this level after retracing could help us time a trade and improve the reward to risk ratio.
Of course, we also have-to consider how the BOJ feels about a stronger Yen. Earlier today Chief Cabinet Secretary Yoshihide Suga said that its “important to have stable FX rates” (which is code for ‘stop buying Yen’) and Japan’s Finance Minister stated they’re watching the US Chinese tariffs “very closely”. Markets are yet to take notice mind, but it wouldn’t be hard to imagine firmer wording from government and banking officials to deter unfavourable speculation against their currency. Therefore USD/JPY is more than a barometer of risk as politics are likely to be a key driver for the pair. So we suggest to be on guard for spikes in both directions as this trade war appears to be just heating up.
