🔮 Better than the Oracle? Our Fair Value found this +42% bagger 5 months before Buffett bought itRead More

USDHKD Bounces Off 61.8%

Published 12/29/2011, 06:46 AM
Updated 02/13/2020, 10:25 AM
EUR/USD
-
USD/SGD
-
USD/HKD
-
JP225
-
GUID
-

The USDHKD pair has moved higher after testing the 61.8% retracement on the back of a USD bid in the market. Although the 100 day looks poised to touch the 200day from the topside, a continued USD bid could lead the pair to retest trendline resistance during the 1st quarter of 2012.

<span class=
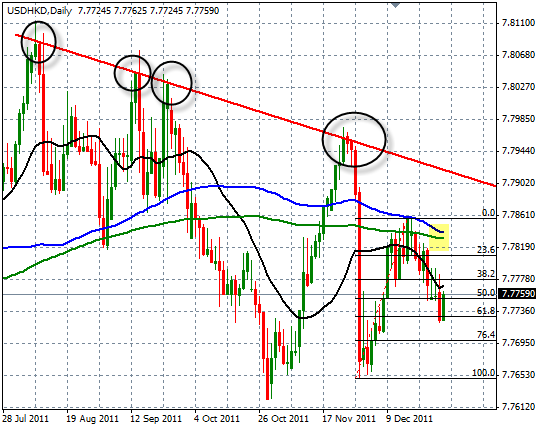
USD/HKD CHART" title="USD/HKD CHART" width="536" height="427">

EURUSD Breaks 1.29


On a quick move early in the Nikkei session the EURUSD pair broke below the 1.29 handle momentarily and looks poised to continue lower to end 2011. There is little in the form of technical support for the pair beyond the trending Bollinger Band until the August 2010 lows around the 1.26 handle.

<span class=
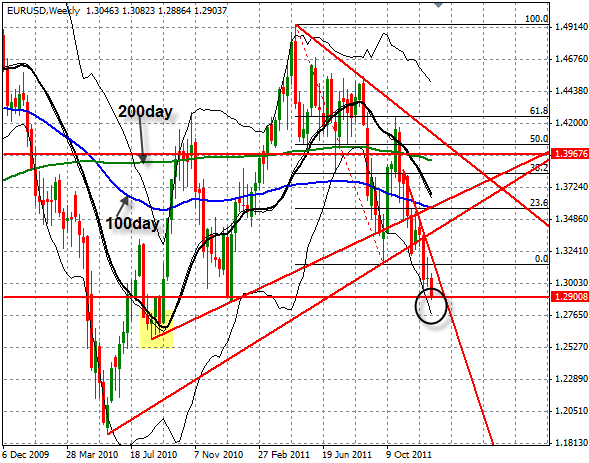
EUR/USD CHART" title="EUR/USD CHART" width="589" height="463">

USD/SGD getting close to the top of this downward wedge


USDSGD

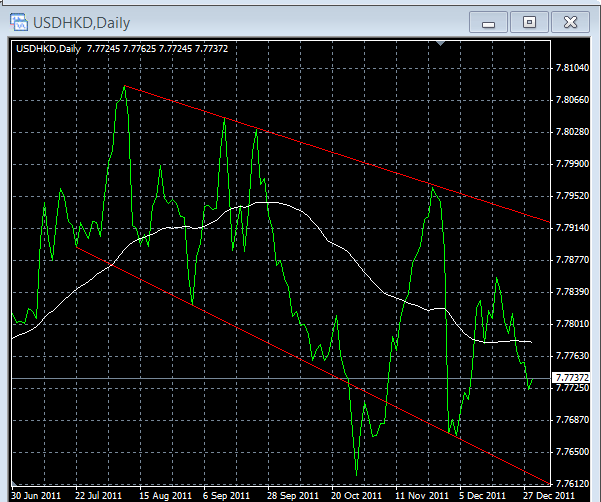
USD/HKD grinding lower in this downward channel


<span class=USD/HKD CHART" title="USD/HKD CHART" width="601" height="502">

Latest comments

Loading next article…
Risk Disclosure: Trading in financial instruments and/or cryptocurrencies involves high risks including the risk of losing some, or all, of your investment amount, and may not be suitable for all investors. Prices of cryptocurrencies are extremely volatile and may be affected by external factors such as financial, regulatory or political events. Trading on margin increases the financial risks.
Before deciding to trade in financial instrument or cryptocurrencies you should be fully informed of the risks and costs associated with trading the financial markets, carefully consider your investment objectives, level of experience, and risk appetite, and seek professional advice where needed.
Fusion Media would like to remind you that the data contained in this website is not necessarily real-time nor accurate. The data and prices on the website are not necessarily provided by any market or exchange, but may be provided by market makers, and so prices may not be accurate and may differ from the actual price at any given market, meaning prices are indicative and not appropriate for trading purposes. Fusion Media and any provider of the data contained in this website will not accept liability for any loss or damage as a result of your trading, or your reliance on the information contained within this website.
It is prohibited to use, store, reproduce, display, modify, transmit or distribute the data contained in this website without the explicit prior written permission of Fusion Media and/or the data provider. All intellectual property rights are reserved by the providers and/or the exchange providing the data contained in this website.
Fusion Media may be compensated by the advertisers that appear on the website, based on your interaction with the advertisements or advertisers.
© 2007-2024 - Fusion Media Limited. All Rights Reserved.