Currencies
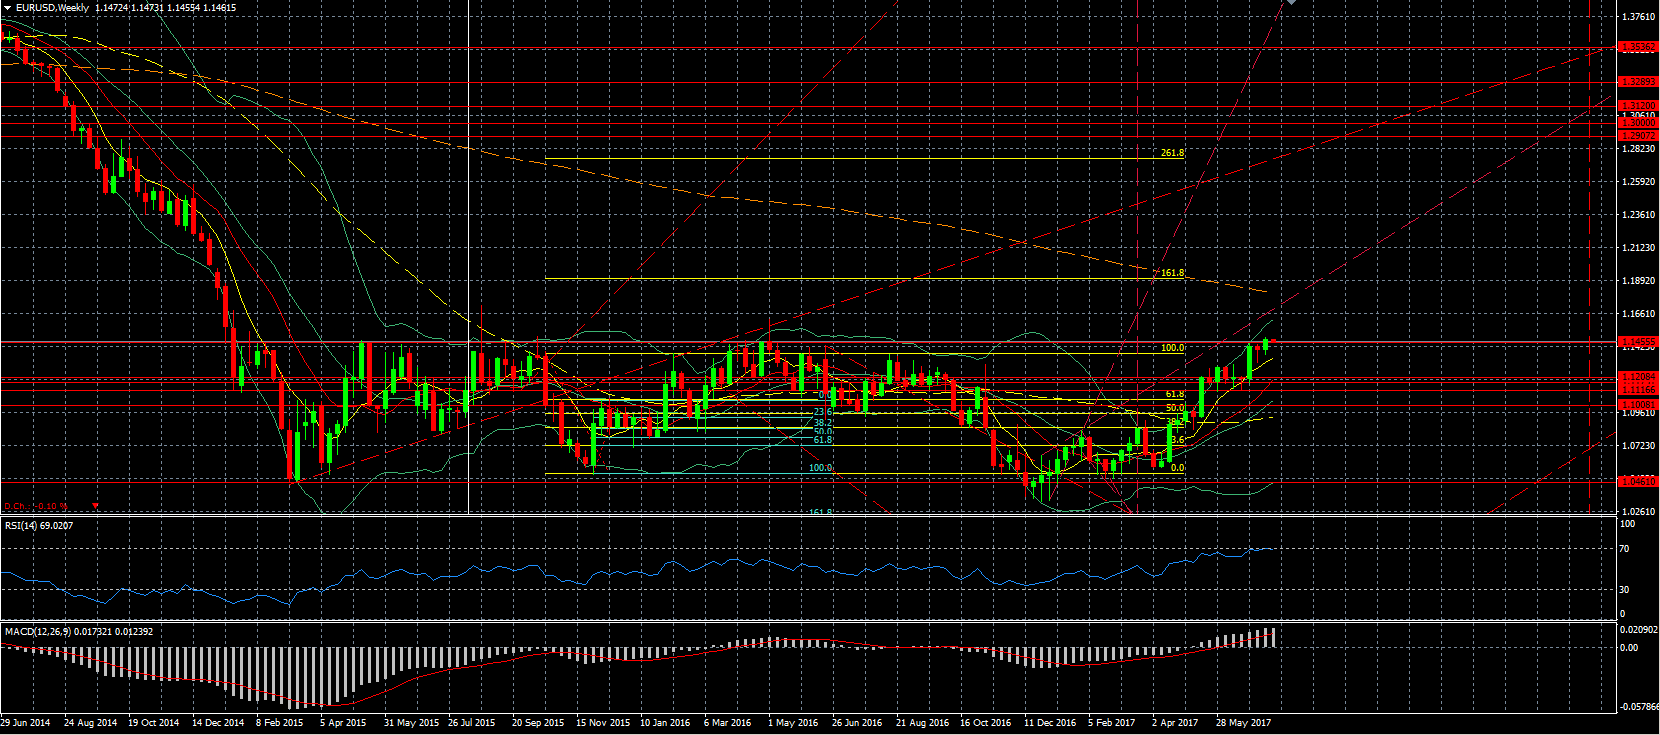
EUR/USD – the inflation data out of the US was not good, as also the retails sales number disappointed, sending the USD lower. The likelihood that the FED will feel comfortable of raising the interest rate once more this year and start working on reducing the balance sheet of $3.5 trillion is much lower now. There was already concern that inflation was not picking up, even though there is full employment. Up until now, most FED officials argued that the low inflation was transitory, but with the disappointing inflation data, there is even more doubt that this is indeed the case. Today will also see inflation data out of the Eurozone. Technically we are seeing that we remain trading a crucial area on the weekly chart.
USD/JPY – extended its drop after the weak US data and therefore completed the first weekly drop in a month. on Thursday, it is the turn of the BOJ again to set the interest rate and its policy statement. While no expectation is expected in either, it is expected that the BOJ will change its outlook slightly.
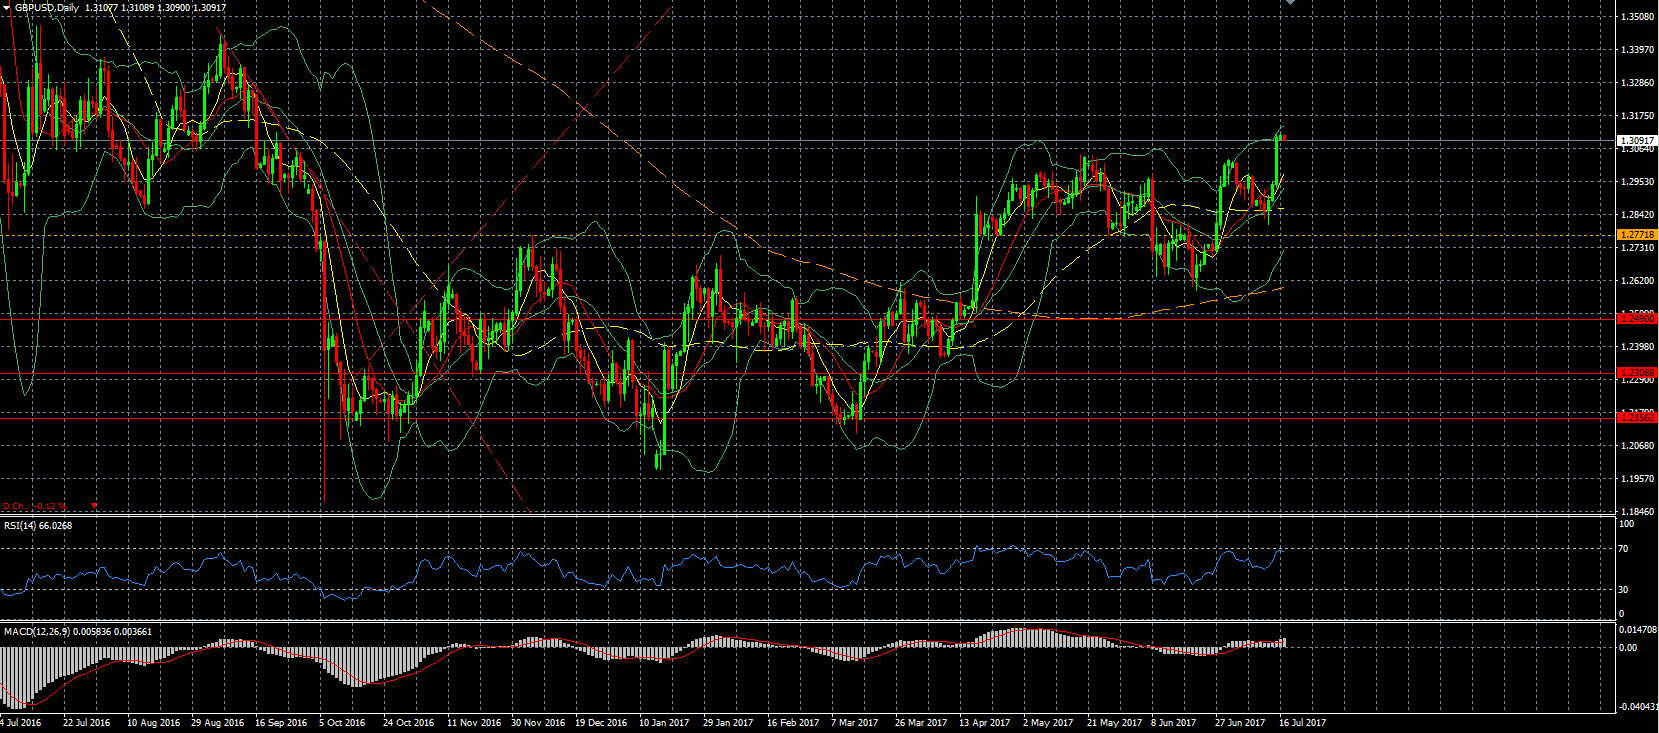
GBP/USD – the GBP had another very strong day on Friday, breaking through the temporary resistance around the 1.295 level and basing itself above the 1.30 level to reach the highest level since September. This all thanks to the weakness of the USD and the possibility that the BOE will raise the interest rate. Today will see the first real Brexit negotiations taking place which could cause some pressure on the GBP.
USD/CAD – reached the lowest level in over 2 years as the USD continued to weaken as the CAD strengthened further due to the rise in oil price.
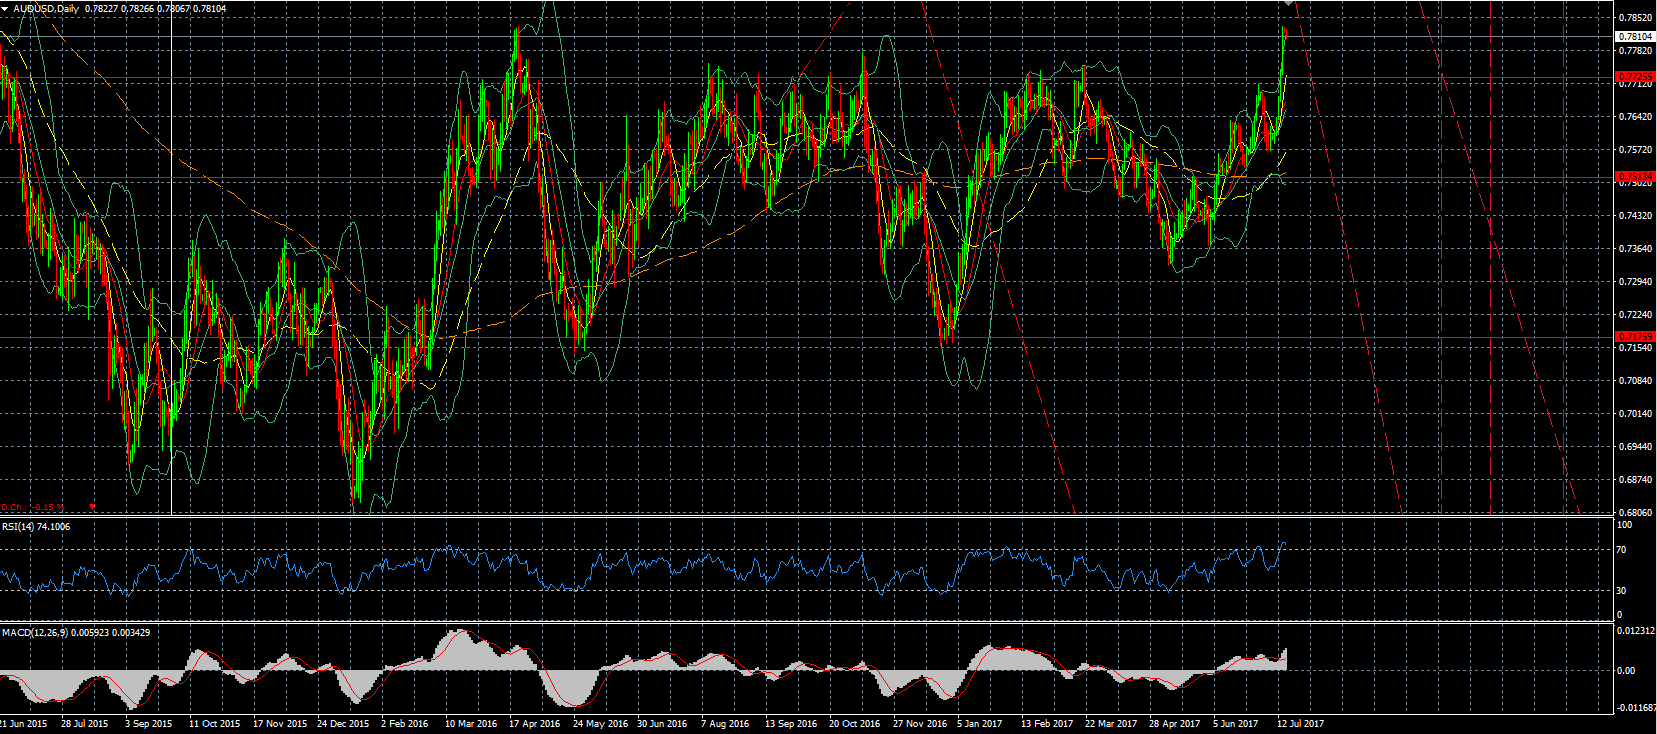
AUD/USD – rose to the highest level in well over a year after the weak inflation data out of the US. Data out of China was also better than expected this morning, but it didn’t have a major impact on the AUD this time around, at least not yet. Tonight we will get the meeting minutes of the last RBA meeting.
NZD/USD – moved up again on Friday as the USD weakened, but is down this morning, as the RBNZ Deputy Governor argued that a weaker NZD would economic growth. Tonight we will get to see the inflation data, where a slowdown is expected.
USD/ZAR – also here the USD lost ground, but here it was also due to some strengthening of the ZAR after the Chamber of Mined suspended a contentious charter.
Indices
Dollar Index – after the weak data out of the US, which casts serious doubt on the way forward for the FED, the Dollar Index dropped to a new 10-month low. There are now serious doubts if the FED can move forward with its intended goals of reducing its massive balance sheet and continue to increase the interest rate. We are now nearing the next support level around the 94.57 level.
S&P 500 – rose to a new record high as the first major earnings came in better than expected, lifting the expectation further for the rest of earning season. The fact that the FED is unlikely to be able to move full speed ahead with monetary tightening due to the weaker than expected data on Friday was also helpful for equities.
Commodities
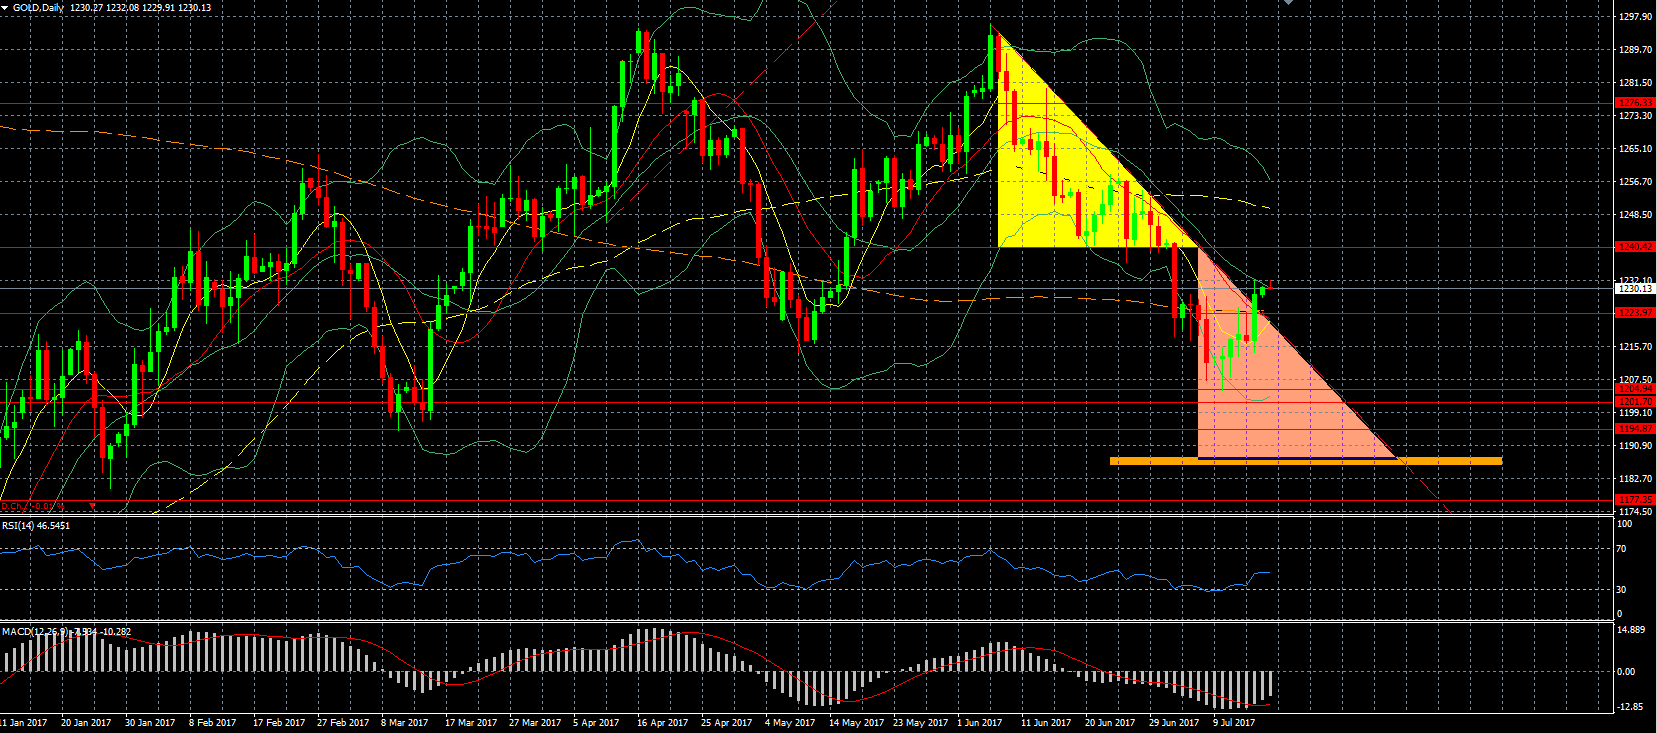
Gold – as we could expect, the disappointing inflation data out of the US helped gold break through the resistance as well as the downwards trend line, leaving the danger of dropping below the 1200 level behind it for now.
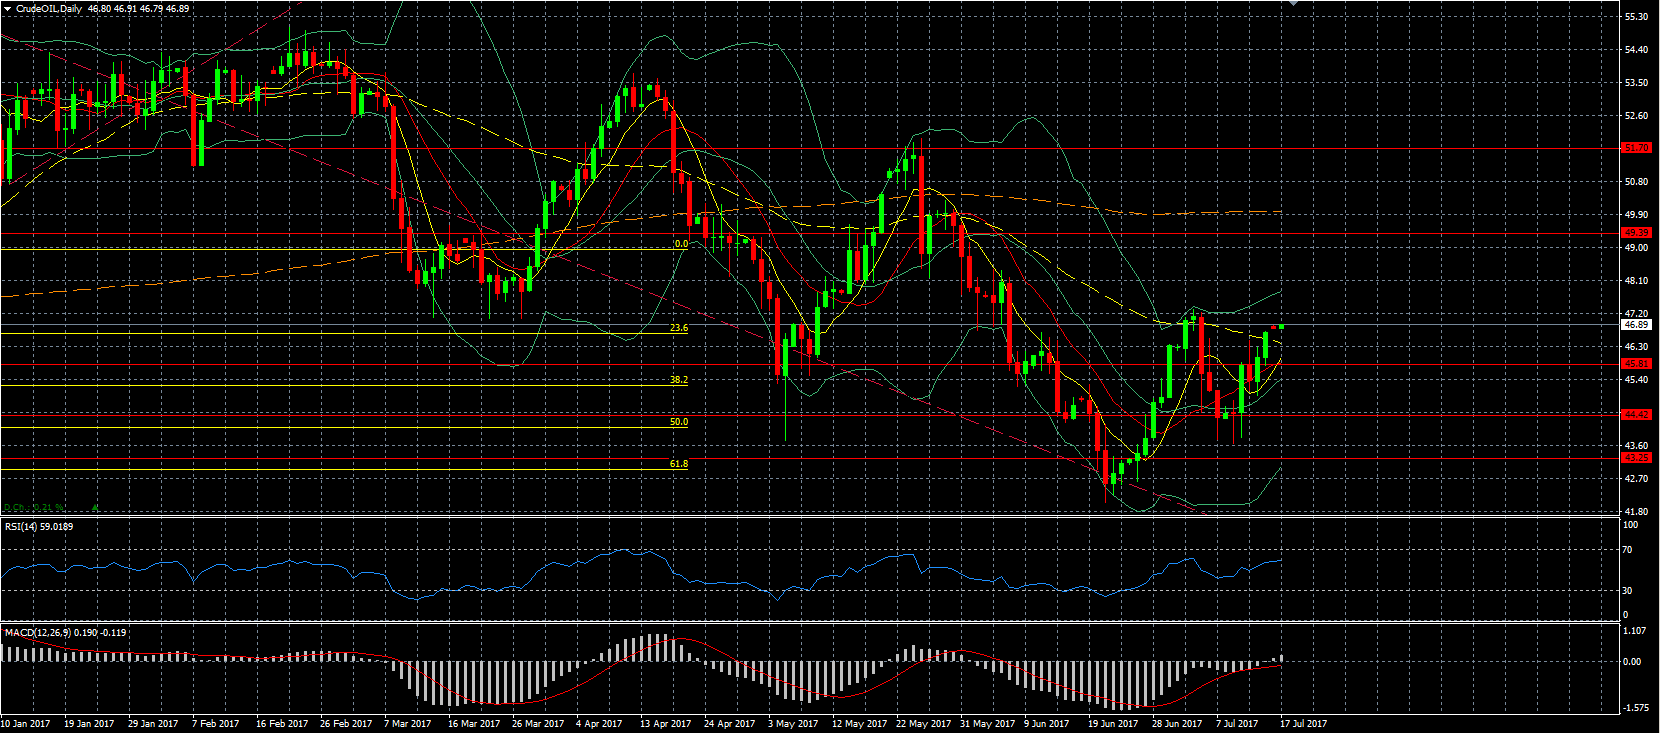
Oil – oil continued to move higher, and is targeting the 47 level again. The main reason is not that OPEC is shifting gear, although we will wait to see what the extraordinary meeting of today is about, but rather the increase in demand. This was reinforced this morning after data out of China showed their economy continues to grow and therefore demand for oil is expected to remain high. The number of active rigs in the US meanwhile increased again, indicating that production in the US will continue to rise. However, we definitely start to see a change in direction of inventories in the US, which has been dropping steadily over the last few weeks. Another drop this week could help oil near the 50 level again, depending obviously as well on comments out of OPEC.
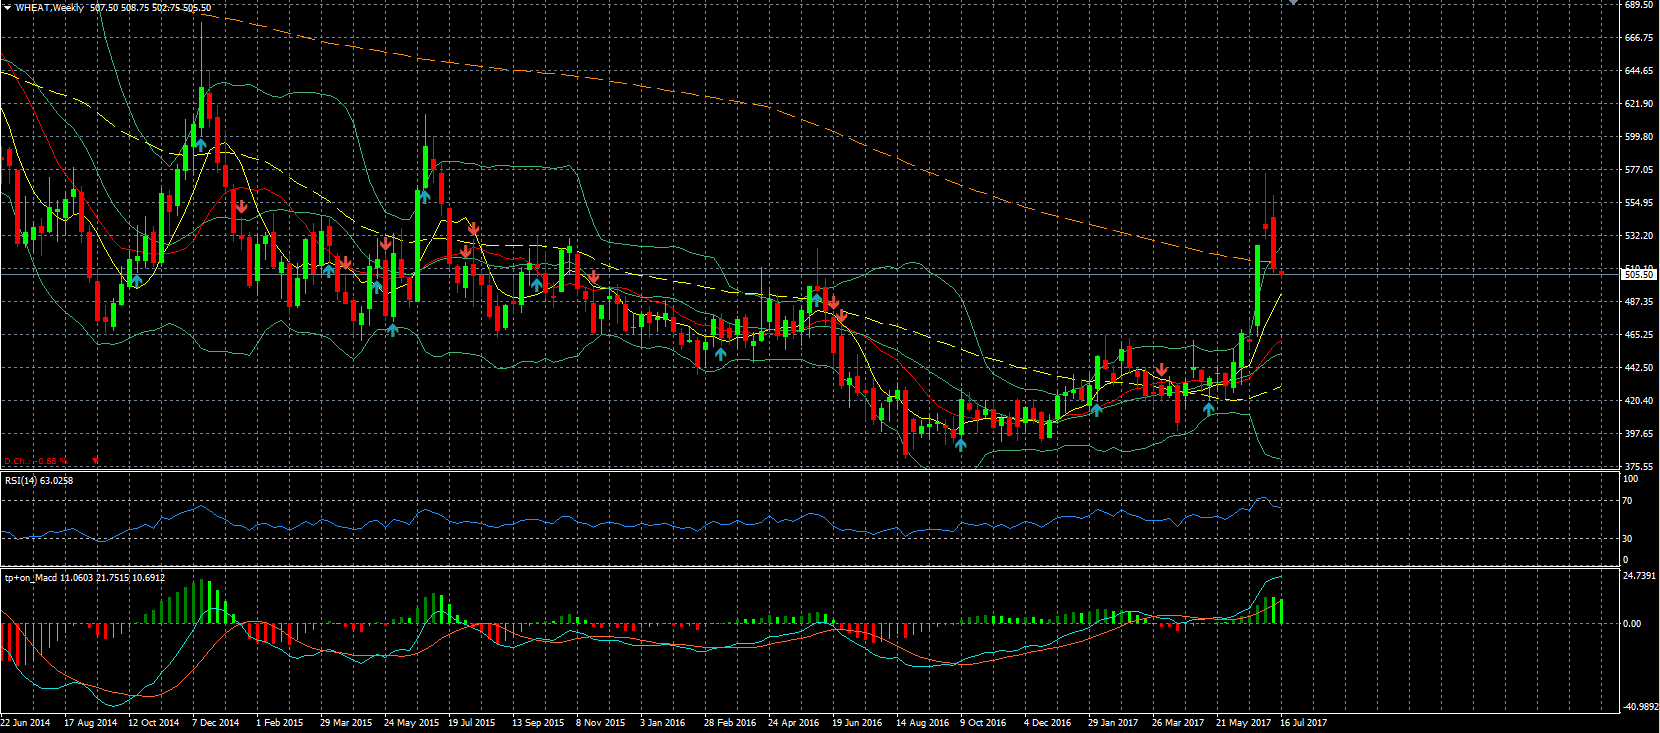
Wheat – after reaching a 2-year high at the start of the month because of the lack of (forecasted) rain, it has dropped sharply last week, as weather forecast have turned more positive with rainfall expected and the WASDE report which, although it projected lower production, expects the overall stock to be higher than previously thought.
Stocks
Citigroup (NYSE:C) – reported a better than expected revenue, which came in at $17.9 billion. However, it was not able to benefit and closed lower, mainly due to trading revenue dropping and a less positive outlook.
JP Morgan – reported a record profits in several sectors, with overall revenue beating the forecast and totaled $25.5 billion and a profit of $7.03 billion. Also here the stock was unable to benefit due to diminished expectations for the coming quarters.
Teva – dropped as there is some uncertainty regarding the CEO position that was offered to AstraZeneca CEO Pascal Soriot, with reports saying he has turned the offer down.
