
USD/JPY: Profit taken on short position, strong growth in Japan's economy
Macroeconomic overview: Japan's economy expanded at an annualised rate of 2.2% in January-March, posting a fifth straight quarter of expansion led by solid exports and private consumption. The preliminary reading for first-quarter GDP was better than market expectations for 1.7% growth.
Compared to the December quarter 2016, private consumption rose 0.4%, following a stagnation in the previous period and adding 0.2 percentage point to growth. Private non-residential investments/ capital expenditure unexpectedly increased by 0.2%, after declining 1.9% in the December quarter. Private residential investment grew by 0.7%, faster than a 0.4% rise in the fourth quarter.
External demand added 0.1 percentage points to growth, as exports of goods and services rose 2.1% (from 3.4% in the previous three months) while imports went up 1.4% (from 1.3%).
Positive data should offer some relief to Bank of Japan policymakers, who hope the economy is now gathering enough momentum to drive up inflation that remains stubbornly below their 2% target.
The economy marked the fifth straight quarter of expansion, the longest growth run since a six-quarter streak through 2006, when the BOJ was exiting from its previous quantitative easing programme on signs of strength in the economy.
The dollar recovered slightly against the yen in Asian trading after a combination of recently poor U.S. data and revelations about the investigation of Trump's ties to Russia drove its biggest daily fall since last July. But it was quickly back on the defensive in early European deals.
Technical analysis: The USD/JPY relapsed to register a daily close below the cloud, adding to the underlying bearish bias. The drop has broken 110.52 (61.8% fibo of April-May rise). Bulls would have to break back above the cloud top (currently at 112.12) in order to gain a foothold in the market. But in our position more likely scenario is further USD/JPY drop. 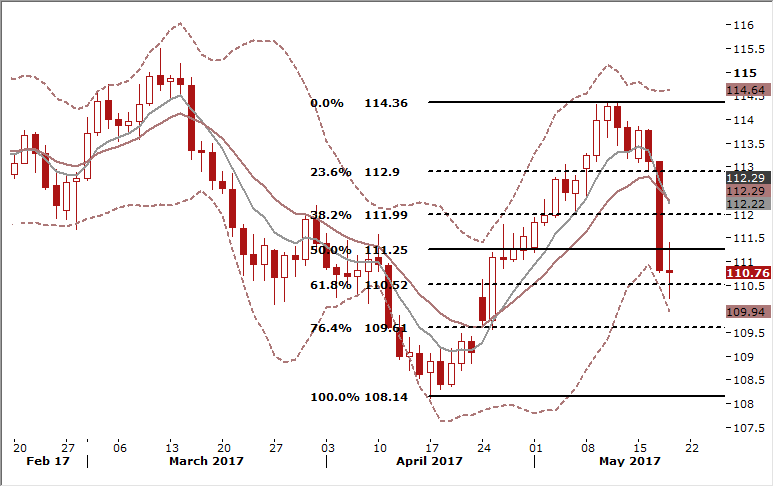
Short-term signal: Profit taken on USD/JPY short. We will consider opening another short position in the area of 111.50-112.10
Long-term outlook: Flat
AUD/USD: Short-lived reaction to better-than-expected jobs report
Macroeconomic overview: Australia’s unemployment rate slipped to 5.7% in April , compared with market expectations for a steady 5.9%. Employment was up by 37.4k in April vs. market forecast for a rise by 5k. All of the gains in jobs in April came from part-time employment which soared 49k while full-time work fell by 11.6k.
Over the past year, the increase in part-time jobs at 111.3k has outpaced the rise in full-time employment of 80.7k. That is one reason wages are growing at a record low rate, undermining domestic consumption.
Annual employment growth is running at 1.6%, and forward-looking indicators of employment such as job ads and business surveys have also been generally positive.
The Reserve Bank of Australia held interest rates at a record low 1.50 percent for a ninth straight month in May as it balances weak domestic demand and inflation against escalating household debt. It has repeatedly expressed worries about a "mixed" labour market. The minutes of its May policy meeting showed that board members had an in-depth discussion about employment, including the increasing share of part-time work.
Technical analysis: The AUD jumped after better-than-expected jobs report. But the reaction was short-lived and the pair is back at today’s open level. If the market closes near current level, it may suggest that recent recovery is over. On the flip side, the RSI is biased up. Technical analysis provides no clear buy/sell signal for the AUD/USD. 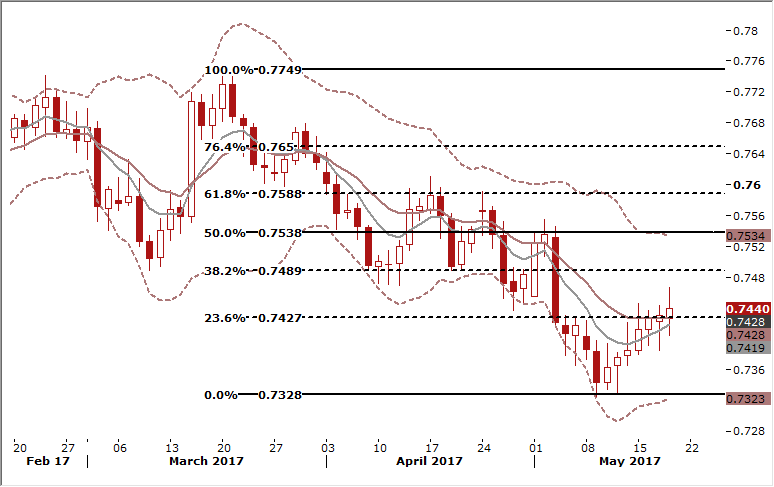
Short-term signal: Long at 0.7390 for 0.7540. Despite no clear signals from technical analysis, we think improving macroeconomic fundamentals would support the AUD.
Long-term outlook: Bullish
EUR/GBP: British retail sales surpassed expectations
Macroeconomic overview: Retail sales volumes jumped by 2.3% on the month in April - beating market average forecast of a 1.0% rise - after a sharp 1.4% fall in March that ended the weakest calendar quarter since 2010.
The strong retail sales tally with figures from the Confederation of British Industry, which said retailers reported rapid sales growth during the first part of April. The Confederation of British Industry's monthly retail sales balance spiked to +38 from +9 in March.
The robust retail sales data for April contrast with a generally downbeat tone so far this year, as a pick-up in inflation triggered by the fall in the pound after last year's Brexit vote ate into households' disposable income.
Britons vote in three weeks' time in an early national election May called in part to capitalise on unexpectedly strong economic growth in the months after last year's Brexit vote.
But with inflation now at its highest since 2013 - partly as a result of sterling's tumble following the Brexit vote - the Bank of England has warned that consumers will come under increasing pressure this year.
Official figures on Wednesday showed that average wages in Britain are now rising by less than inflation for the first time since 2014.
But May played down the role of the Brexit vote in pushing up inflation in a news conference on Wednesday, and instead focused on strong job creation in recent years and the record number of people now in work.
The GBP/USD rose above 1.3000 for the first time in almost eight months after today’s retail sales data.
Technical analysis: The EUR/GBP recovery was stopped near 61.8% fibo of March-April drop. The pair fell after better-than-expected British retail sales data, but did not manage to break below the 7-day exponential moving average. This suggests that the recovery may be continued in the coming days. 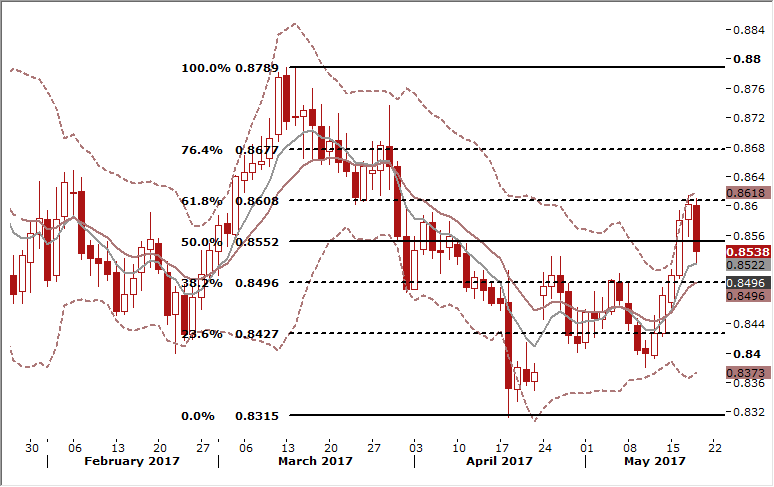
Short-term signal: In our opinion no position is justified from risk/reward perspective.
Long-term outlook: Flat
TRADING STRATEGIES SUMMARY:
FOREX - MAJOR PAIRS: 
FOREX - MAJOR CROSSES: 
PRECIOUS METALS: 
How to read these tables?
1. Support/Resistance - three closest important support/resistance levels
2. Position/Trading Idea:
BUY/SELL - It means we are looking to open LONG/SHORT position at the Entry Price. If the order is filled we will set the suggested Target and Stop-loss level.
LONG/SHORT - It means we have already taken this position at the Entry Price and expect the rate to go up/down to the Target level.
3. Stop-Loss/Profit Locked In - Sometimes we move the stop-loss level above (in case of LONG) or below (in case of SHORT) the Entry price. This means that we have locked in profit on this position.
4. Risk Factor - green "*" means high level of confidence (low level of uncertainty), grey "**" means medium level of confidence, red "***" means low level of confidence (high level of uncertainty)
5. Position Size (forex)- position size suggested for a USD 10,000 trading account in mini lots. You can calculate your position size as follows: (your account size in USD / USD 10,000) * (our position size). You should always round the result down. For example, if the result was 2.671, your position size should be 2 mini lots. This would be a great tool for your risk management!
Position size (precious metals) - position size suggested for a USD 10,000 trading account in units. You can calculate your position size as follows: (your account size in USD / USD 10,000) * (our position size).
6. Profit/Loss on recently closed position (forex) - is the amount of pips we have earned/lost on recently closed position. The amount in USD is calculated on the assumption of suggested position size for USD 10,000 trading account.
Profit/Loss on recently closed position (precious metals) - is profit/loss we have earned/lost per unit on recently closed position. The amount in USD is calculated on the assumption of suggested position size for USD 10,000 trading account.
Source: GrowthAces.com - your daily forex trading strategies newsletter