
Market Snapshot:
Canadian Dollar continues to sell-off across the board during early Asia trading.
Initial estimated from the US suggests Thanksgiving sales may be down, despite stores opening early.
The Fed's Bernanke is also speaking tonight so both of these have potential to get the markets moving.
Later today we have GBP PMI with a concensus of 56.30 - with the UK showing signs of continued economic improvement, it would require an exceptionally low reading to suggests any weakness to the current GBP strength.

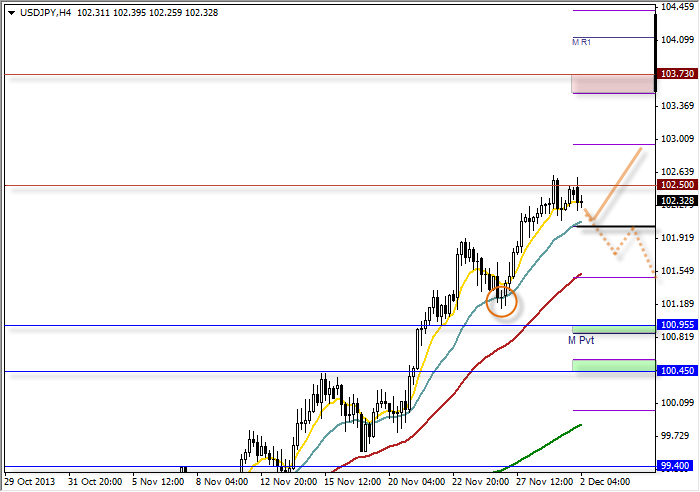
USD/JPY: Clearly bullish; targeting 103.70 highs
Hovering around the 102.50 target I see no immediate threat to the bullish trend. My preferred approach will remain 'buy the dip' however in the event of any deep retracements or sell-offs there areas around 102 and 101.50 that may provide areas of support.
The 105.50 level comprises of the 50 DMA and weekly S1 level. Even if we trade down to these levels we are still above the prior swing low of 101.13 so the bullish trend will technically remain intact.
Ideally I favour buy setups near the 102 level above the monthly Pivot to target 103.70 highs (eventually).
 USD/JPY Hourly Chart" title="USD/JPY Hourly Chart" width="697" height="629">
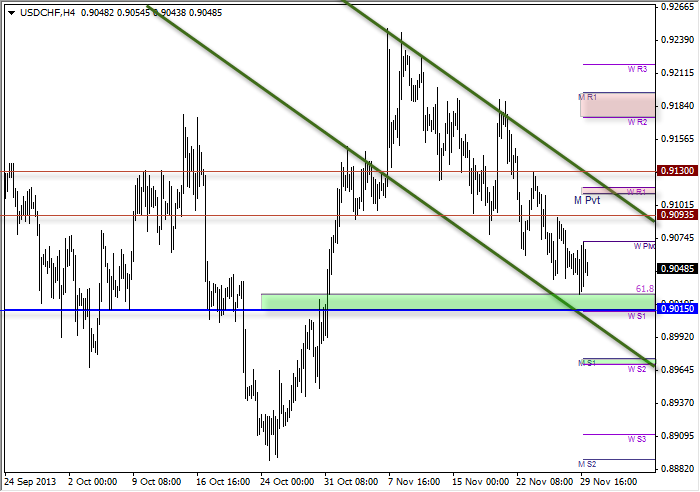
USD/CHF: Fine line between bullish and bearish
Whilst I maintain the view we are pending USD strength the Swissy continues to grind lower within a seemingly corrective price fashion.
We are now trading above the 61.8% retracement level and a pivotal S/R at 0.9015 and have to admit we are running out of layers of support to keep my bullish Swissy view alive. So this green support zone is my line in the sand.
However in the even we do get a bullish run we are not short of areas of resistance which may cause us issues. We are currently trading below the weekly pivot which if broken we still need to break above the adjacent declining trendline/resistance. Additionally we have pivotal S/R at 0.909.
So for the daily timeframe I would want to see a convincing break above the bearish channel before fully committing to the long side, and until such an event occurs then intraday trading within the channel is the preferred method.
 USD/CHF Hourly Chart" title="USD/CHF Hourly Chart" width="697" height="629">
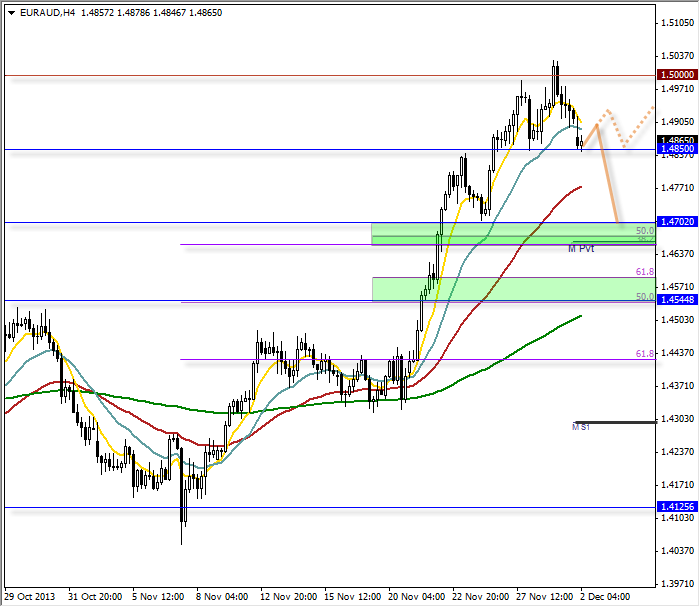
EUR/AUD: Primary trend remains bullish however, expecting deeper retracement
I am so far pleased with how this analysis is panning out. Whilst we did see a break above 1.50 it does appear due to pullback. It also turned out the break above 1.50 saw a quick reversal and has since gapped down to the next level of support.
Whilst I see potential for a bullish retracement from these support levels, and favour a downside break and for price to target the 1.047 support zone. If we trade back down to these levels I will then reassess to try and gauge is the retracement is over and seek buying opportunities, or question if this is the beginning of a much larger move.
 EUR/USD Hourly Chart" title="EUR/USD Hourly Chart" width="697" height="629">