Get 40% Off
🚨 Volatile Markets? Find Hidden Gems for Serious Outperformance
Find Stocks Now

USD/JPY's Flat Price Action Warns Of A Strong Breakout In The Making

Published 08/25/2016, 05:06 AM
Updated 08/29/2019, 07:20 AM

USD/JPY has been caught within the inside bar range for nearly 6 straight days and is indicative of a strong breakout in the making. With traders preparing for Friday's speech by Janet Yellen, it could very well be the catalyst needed for USD/JPY. Meanwhile, EUR/USD continues to drift lower as we maintain the downside bias for a test to 1.1200 heading into Friday's big event.

EUR/USD Daily Analysis
EUR/USD 4 Hourly Chart

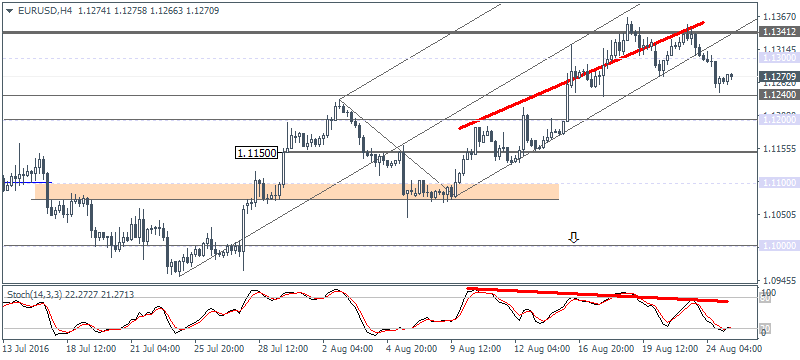
EUR/USD (1.1270): EUR/USD closed bearish yesterday with the breakout from the inside bar's low of 1.1284 confirming the downside. Support at 1.1200 is now in sight. Any pullbacks could be limited to the inside bar's low of 1.1284 through 1.1300. On the 4-hour chart, we can see the Stochastics currently in the oversold area following the downside breakout below 1.1300 which confirms the view that EUR/USD could see a short-term/intraday bounce to the upside. Support is seen at 1.12400 on the smaller time frame while 1.1200 remains the main support of interest.

USD/JPY Daily Analysis
USD/JPY 4 Hourly Chart

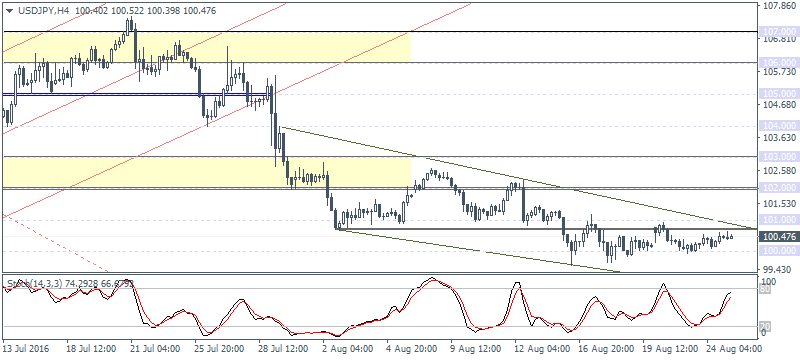
USD/JPY (100.47): USD/JPY continues to remain muted with price seen trading strongly inside the range of 101.16 - 100.038, set on 17 August. We maintain the view that 100.50 - 101.00 needs to be cleared in order for USD/JPY to see any hopes of a test to 102.00 - 103.00 region. To the downside, support at 100.00 seems to hold prices for now.

GBP/USD Daily Analysis
GBP/USD 4 Hourly Chart

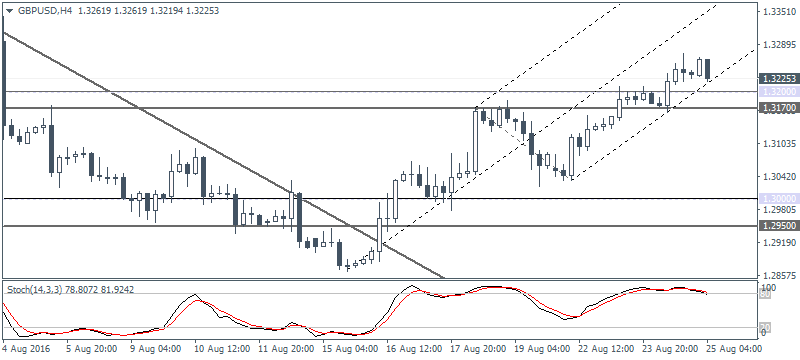
GBP/USD (1.3225): GBP/USD extended the gains to 1.3200 but the daily chart shows a potential hidden bearish divergence near this level. This could mean that GBP/USD could post a minor correction back to 1.3000 to establish support provided GBP/USD can break down below 1.3200 - 1.31700 level which is now likely to hold prices. On the 4-hour chart there are no clear indications just as yet, but watch for a possible bearish divergence on the Stochastics to confirm this view.

3rd party Ad. Not an offer or recommendation by Investing.com. See disclosure here or remove ads .

Gold Daily Analysis

XAU/USD 4 Hourly Chart

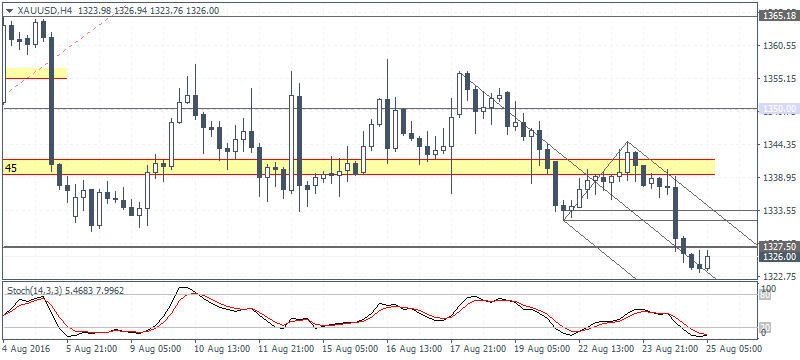
XAU/USD (1326.00): Gold prices closed at 1324.16 yesterday with price currently at the minor support of 1327.50. In the near term, we can expect gold prices to post a modest bounce to the upside, back to the 1332 - 1335 region. However, the bias remains to the downside for a test to 1300. The bearish view changes only if gold prices manage to post a bullish close above 1332 - 1335, in which case a retest back to 1350 cannot be ruled out.

Latest comments

Risk Disclosure: Trading in financial instruments and/or cryptocurrencies involves high risks including the risk of losing some, or all, of your investment amount, and may not be suitable for all investors. Prices of cryptocurrencies are extremely volatile and may be affected by external factors such as financial, regulatory or political events. Trading on margin increases the financial risks.
Before deciding to trade in financial instrument or cryptocurrencies you should be fully informed of the risks and costs associated with trading the financial markets, carefully consider your investment objectives, level of experience, and risk appetite, and seek professional advice where needed.
Fusion Media would like to remind you that the data contained in this website is not necessarily real-time nor accurate. The data and prices on the website are not necessarily provided by any market or exchange, but may be provided by market makers, and so prices may not be accurate and may differ from the actual price at any given market, meaning prices are indicative and not appropriate for trading purposes. Fusion Media and any provider of the data contained in this website will not accept liability for any loss or damage as a result of your trading, or your reliance on the information contained within this website.
It is prohibited to use, store, reproduce, display, modify, transmit or distribute the data contained in this website without the explicit prior written permission of Fusion Media and/or the data provider. All intellectual property rights are reserved by the providers and/or the exchange providing the data contained in this website.
Fusion Media may be compensated by the advertisers that appear on the website, based on your interaction with the advertisements or advertisers.
© 2007-2024 - Fusion Media Limited. All Rights Reserved.