Get 40% Off
👀 👁 🧿 All eyes on Biogen, up +4,56% after posting earnings. Our AI picked it in March 2024.
Which stocks will surge next?
Unlock AI-picked Stocks

USD Points Higher In Short Term

Published 06/05/2018, 05:16 PM
Updated 07/09/2023, 06:32 AM

UPCOMING RISK EVENTS:

USD: Crude Oil Inventories.
EUR: N/A.
GBP: N/A.
JPY: N/A.
1-Hour EUR/USD

4 Hour EUR/USD
Daily EUR/USD

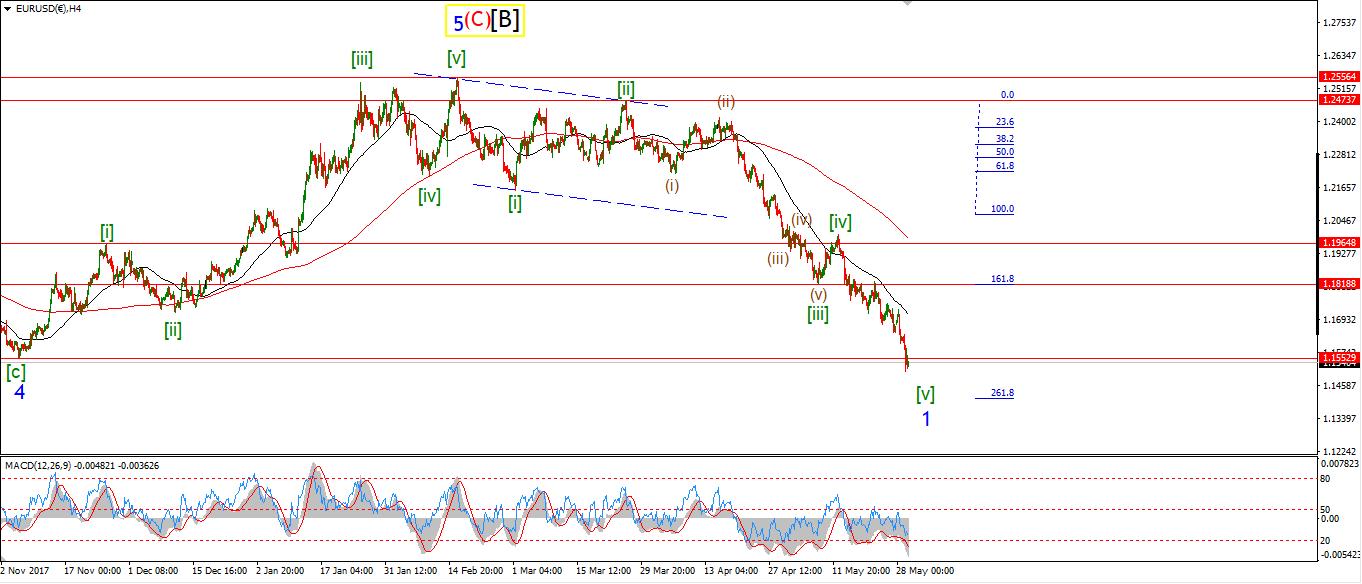
My Bias: long term bearish

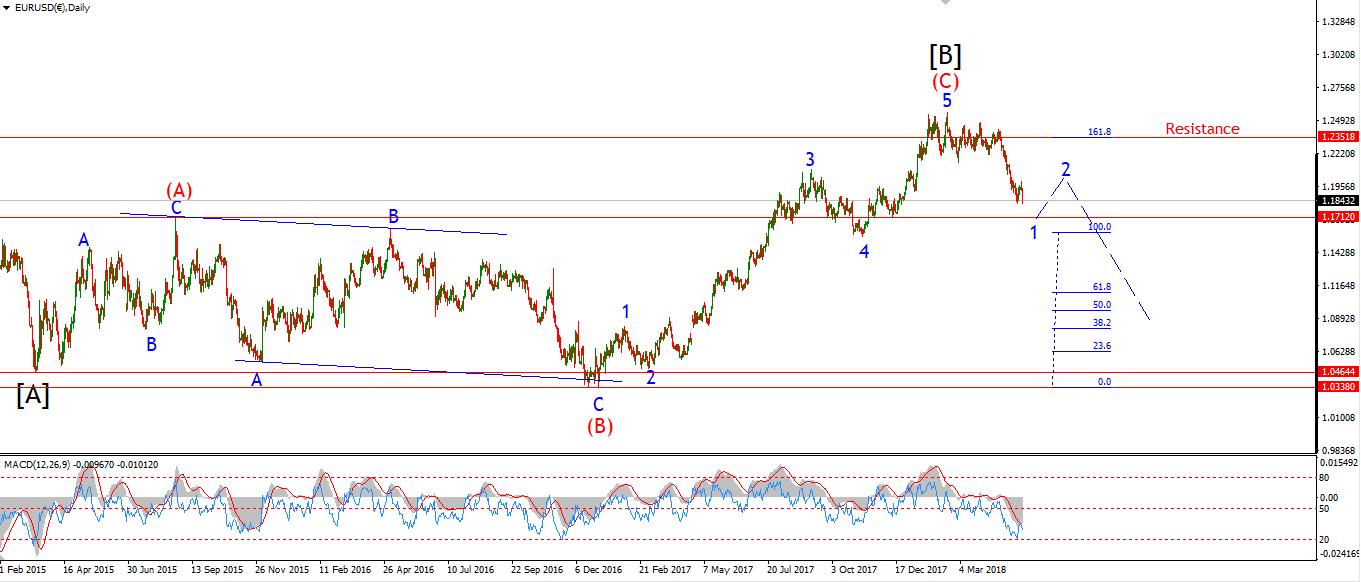
Wave Structure: Topped in wave [B] black.

Long term wave count: lower in wave [C] black.

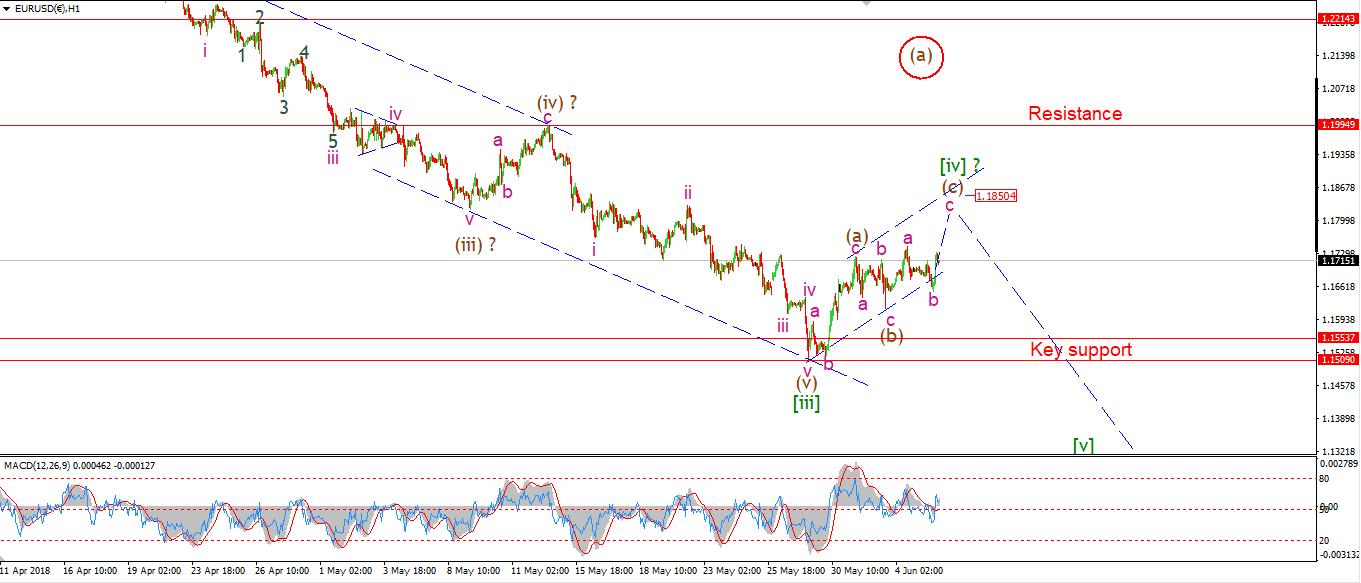
The corrective action in EUR/USD has confirmed my suspicions today.
The price is likely moving higher in a double combination Elliott wave pattern.
The drop off Mondays high has developed into a three wave pattern,
I have labelled this an internal wave 'b' of the larger wave (c) up.
The target for wave (C) remains in the region of 1.1800.

Tomorrow
Watch for wave 'c' pink to continue towards he upper trendline at 1.1800.
At that point we will have a three wave pattern complete in a possible wave [iv].
I will then switch focus to wave [v] down.
30-Minute GBP/USD
4-hour GBP/USD
Daily GBP/USD

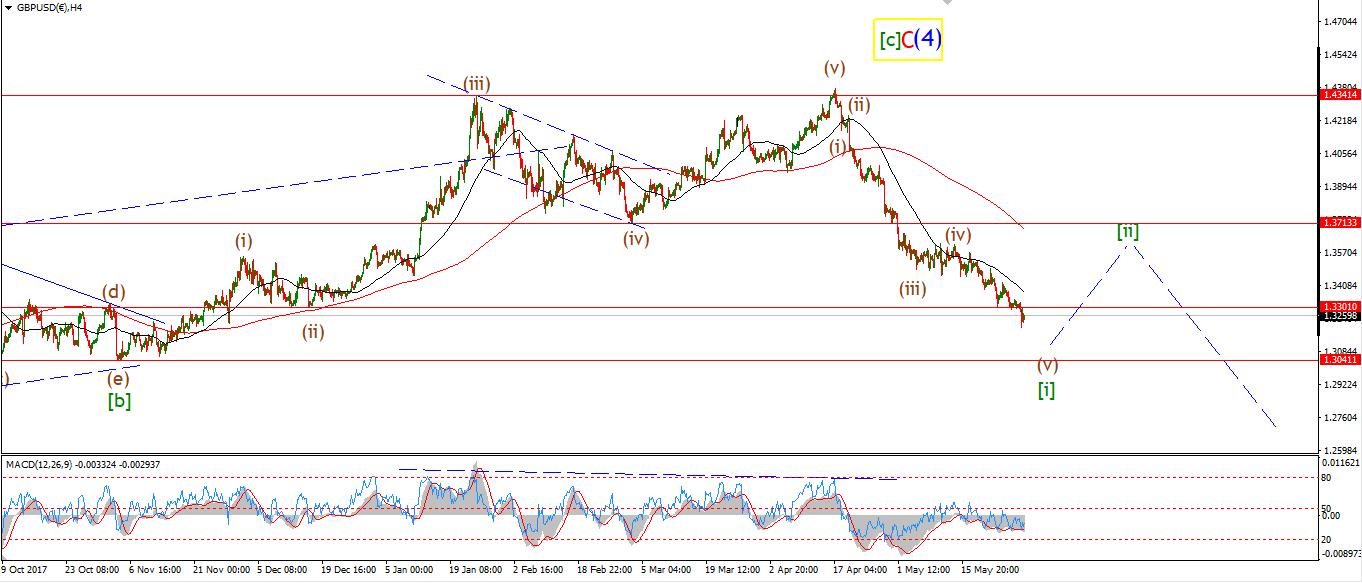
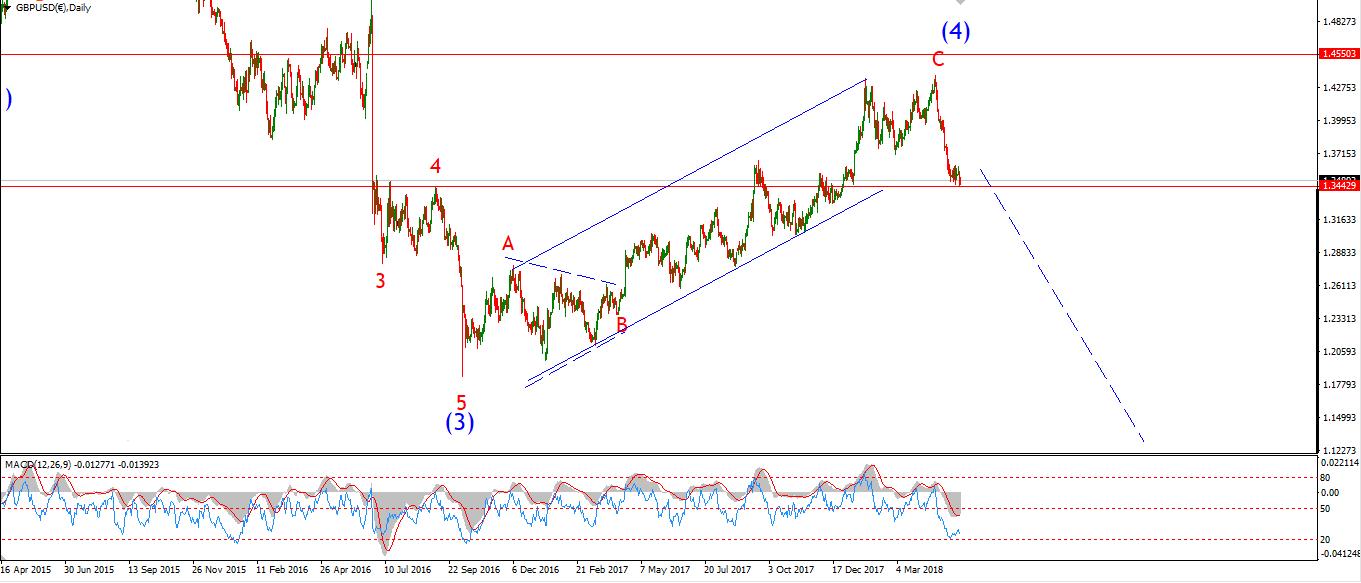
My Bias: short below parity in wave (5).

Wave Structure: completed wave (4) blue correction higher.

Long term wave count: decline in wave (5) blue, below parity

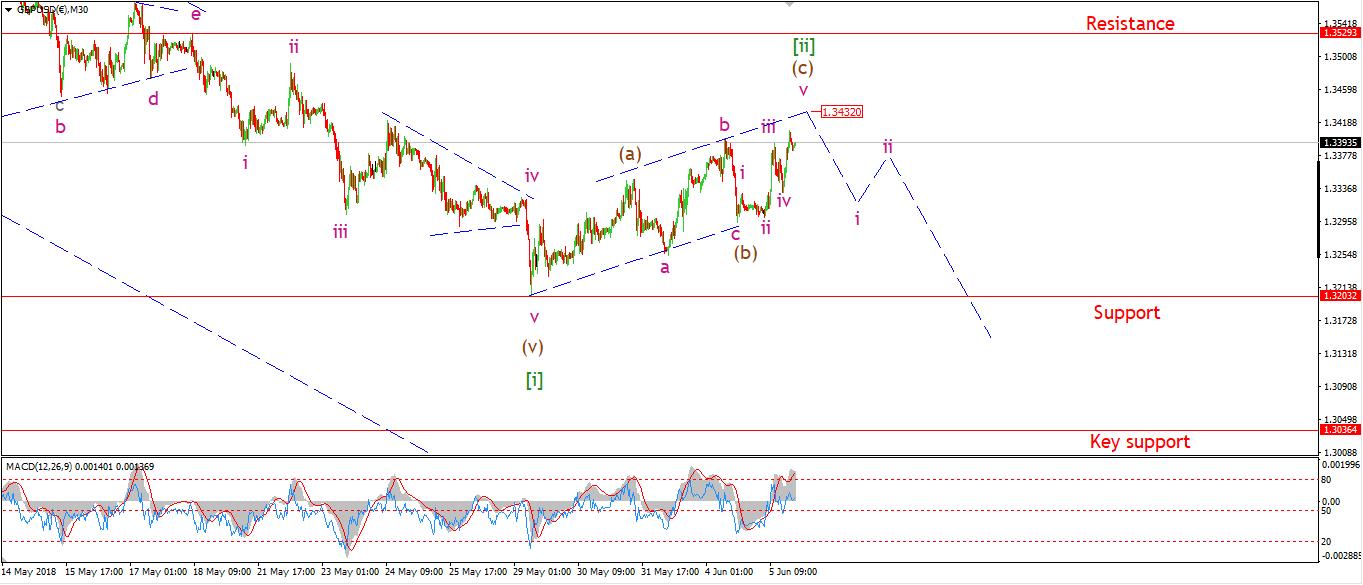
I have altered the short term wave count in wave [ii] green very slightly today.
After todays rally the pattern in wave [ii] has taken the form of a complex flat.

The internal wave (b) is a running flat,
And the price has rallied off that low in a five wave pattern wave (c).
that gives us a 3,3,5 overall structure.

The price is approaching the upper trendline fast today,
The target for wave (c) lies at about 1.3430,

But wave (c) has already broken the high of wave (a),
So, the structure may even be complete at todays high of 1.3408

Tomorrow
Watch for wave (c) to complete at 1.3430,
and an initial turn down in wave wave (i).
By the end of the week we should have an elliott wave indicator sell signal in place in Cable, so eyes on here!
30-Minute USD/JPY
4-Hour USD/JPY
Daily USD/JPY

3rd party Ad. Not an offer or recommendation by Investing.com. See disclosure here or remove ads .

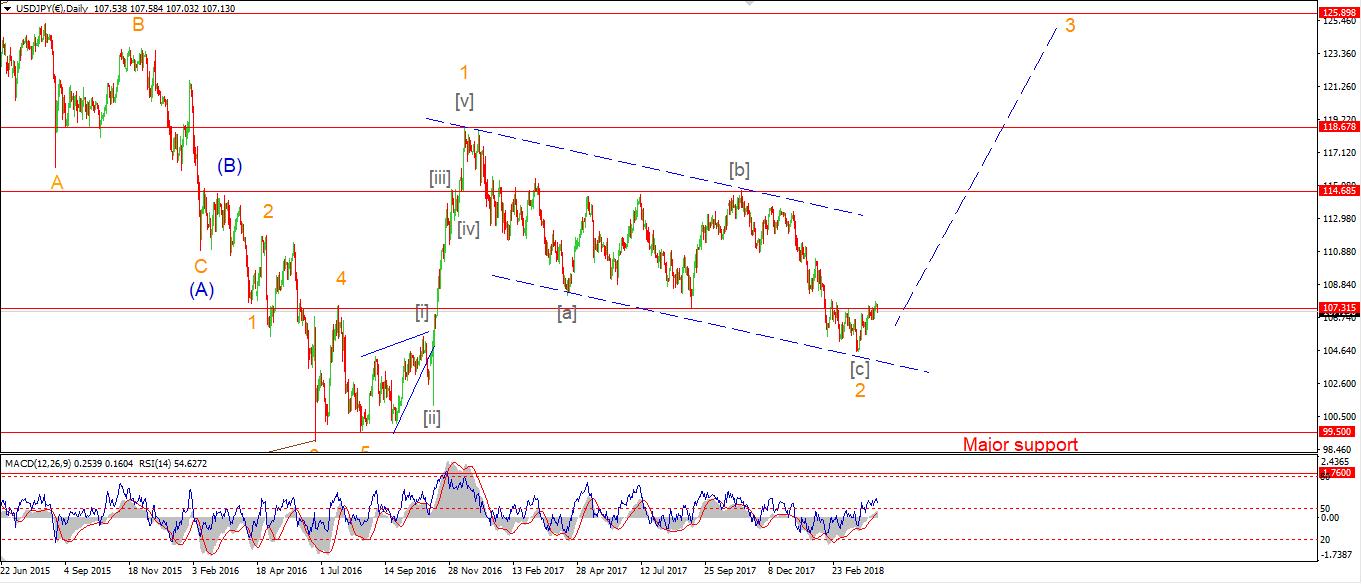
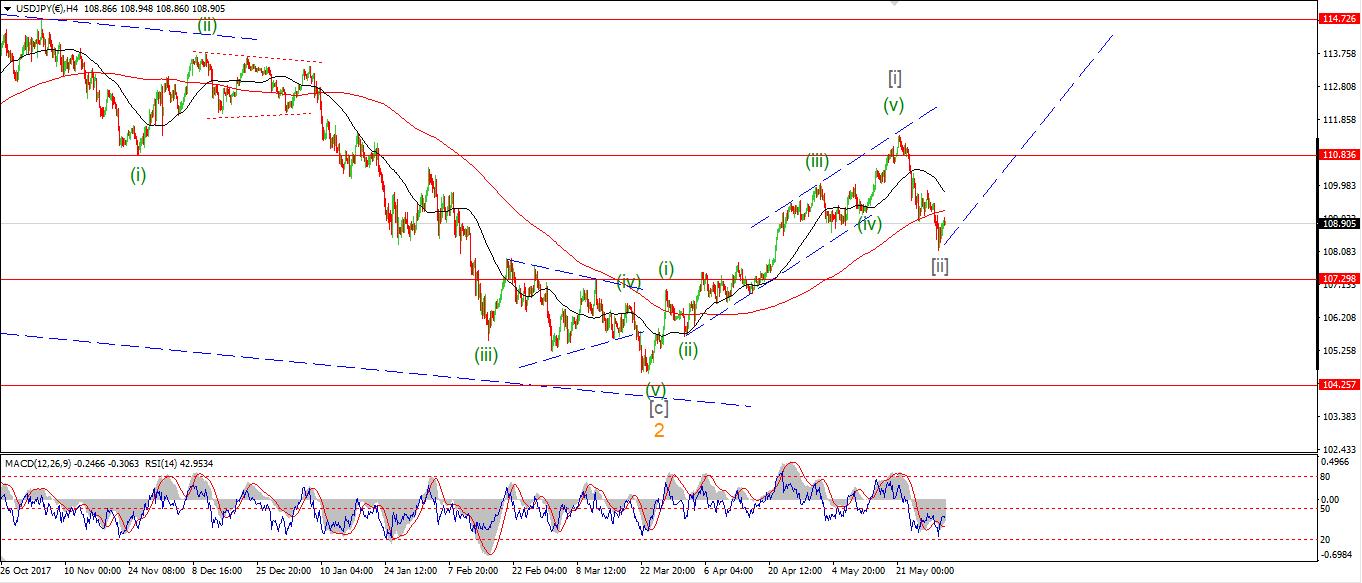
My Bias: LONG

Wave Structure: rally in wave [C]

Long term wave count: wave [C] is underway, upside to above 136.00

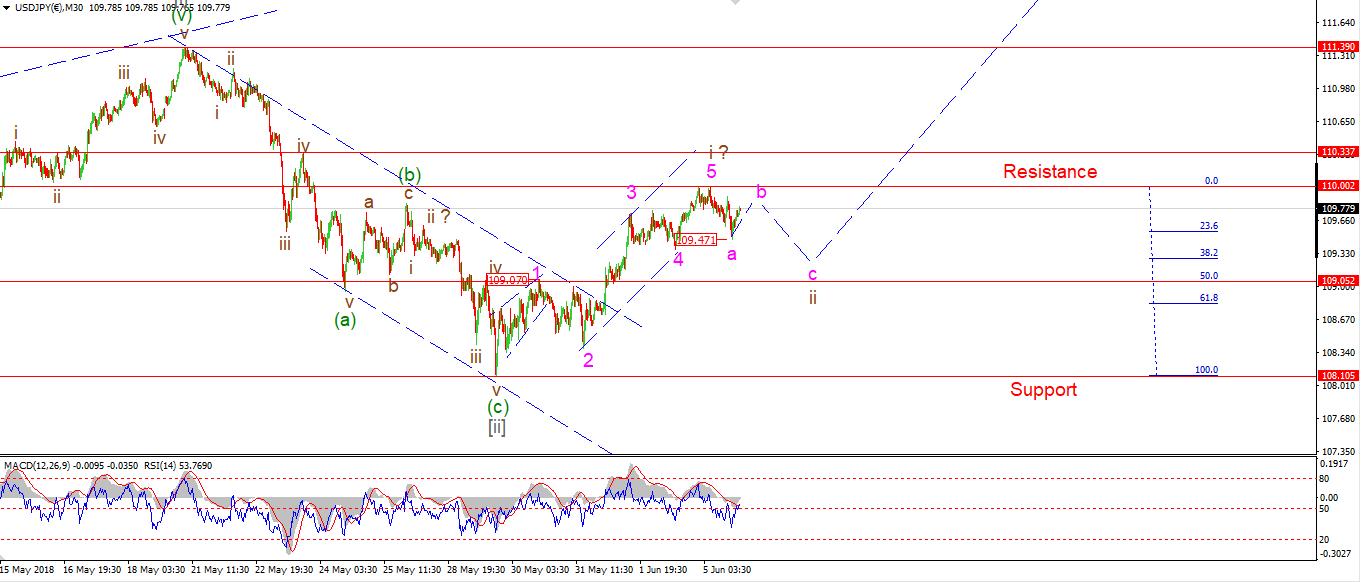
USD/JPY broke above the 110.00 level today,
only just!

The high of the session reached 110.002 and off the high we can see a corrective decline beginning.
We can now identify elliott wave 1 as complete with five waves up.
It is likely that wave 'ii' brown has now begun.
I have labelled wave 'a' down complete at todays lows of 109.47.
Wave 'b' is underway and should complete below 110.002.
the initial target for wave 'c' of 'ii' lies at the 50% retracement level at 109.05.

Tomorrow
Watch for wave 'b' to complete in three waves, and wave 'c' pink to trace out five waves down into 109.05.

Latest comments

Risk Disclosure: Trading in financial instruments and/or cryptocurrencies involves high risks including the risk of losing some, or all, of your investment amount, and may not be suitable for all investors. Prices of cryptocurrencies are extremely volatile and may be affected by external factors such as financial, regulatory or political events. Trading on margin increases the financial risks.
Before deciding to trade in financial instrument or cryptocurrencies you should be fully informed of the risks and costs associated with trading the financial markets, carefully consider your investment objectives, level of experience, and risk appetite, and seek professional advice where needed.
Fusion Media would like to remind you that the data contained in this website is not necessarily real-time nor accurate. The data and prices on the website are not necessarily provided by any market or exchange, but may be provided by market makers, and so prices may not be accurate and may differ from the actual price at any given market, meaning prices are indicative and not appropriate for trading purposes. Fusion Media and any provider of the data contained in this website will not accept liability for any loss or damage as a result of your trading, or your reliance on the information contained within this website.
It is prohibited to use, store, reproduce, display, modify, transmit or distribute the data contained in this website without the explicit prior written permission of Fusion Media and/or the data provider. All intellectual property rights are reserved by the providers and/or the exchange providing the data contained in this website.
Fusion Media may be compensated by the advertisers that appear on the website, based on your interaction with the advertisements or advertisers.
© 2007-2024 - Fusion Media Limited. All Rights Reserved.