Daily Forex Market Preview, 27/09/2018
The markets were seen trading flat through the day in anticipation of the Federal Reserve announcement. As widely expected, the Fed funds rate was hiked by 25 basis points bringing the interest rates to 2.0% - 2.25%.
The Fed, in its press conference, released the dot plot. According to the forecasts, the central bank is expected to hike interest rates one more time this year and follow through with three more rate hikes next year.
In Sweden, the incumbent Prime Minister Stefan Lofven lost a vote of confidence, putting the political landscape into further confusion. The SEK was muted, but market watchers expect some volatility if there are talks of re-election.
The RBNZ held its monetary policy meeting during the overnight trading session. As expected, the central bank left monetary policy unchanged with the official cash rate steady at 1.75%.
The European trading session today will see the release of the ECB's economic bulletin alongside Germany's preliminary inflation data.
The NY trading session is expected to be busy. The durable goods orders data is planned followed by the final revised GDP figures for the second quarter. No changes are expected as the U.S. Q2 GDP is forecast to remain at 4.2%.
Later in the evening, the ECB President Mario Draghi will be speaking. This is followed by a late speech from the Fed Chair, Jerome Powell.
EUR/USD intraday analysis

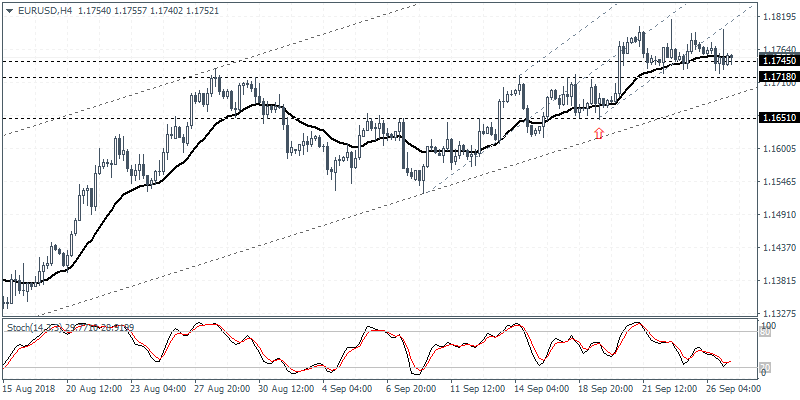
EUR/USD (1.1752): The EUR/USD currency pair managed to hold the ground staying around the 1.1745 handle. With the support area of 1.1745 - 1.1718 holding, price action could be seen pushing gradually higher. The 4-hour Stochastics oscillator is also likely to signal a move to the upside. The common currency will need to break out above the previous highs of 1.1795 to post further gains. The next main target is seen at 1.1960 - 1.1920 level of resistance.
GBP/USD intraday analysis

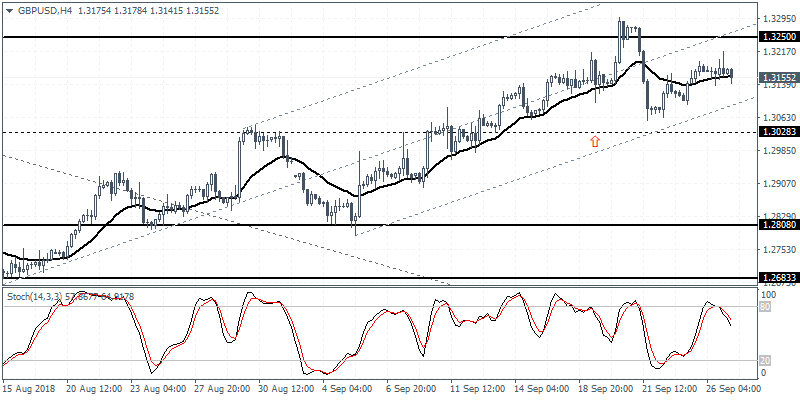
GBP/USD (1.3155): The British pound closed with a doji pattern on Wednesday. Price action is likely to see a modest pullback in the near term. The support at 1.3028 is yet to be tested firmly in the near term. There is scope for GBP/USD to retest the previously established resistance level at 1.3250. However, a bounce of 1.3028 support is required to confirm the upside.
XAU/USD intraday analysis

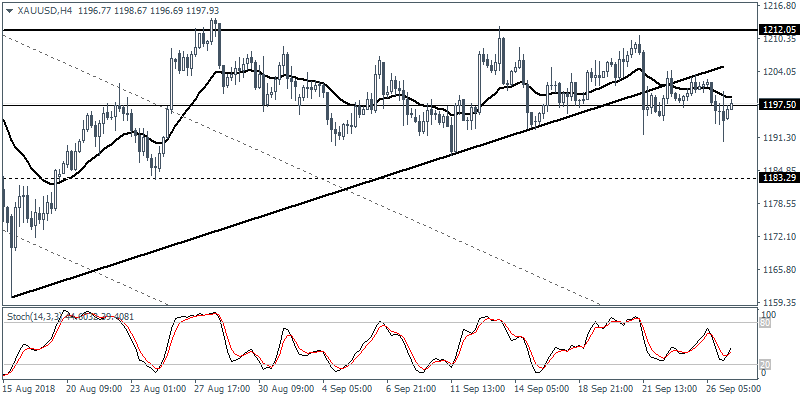
XAU/USD (1197.93): Gold prices continue to trade flat within the 1212.20 and 1196.00 levels. The downside breakout of the minor rising trend line indicates a possible decline toward the 1183.30 level of support. The direction remains flat at the moment, but we could expect to see a reversal near the lower support. Failure to hold the declines near 1183.30 could, however, turn the trend to the downside.
