The U.S. dollar was seen declining as the day unfolded with President Trump removing Rex Tillerson and appointing CIA director Pompeo as the secretary of state. The changes sparked speculation of the increasing number of officials who are more favorable towards protectionist policies.
On the economic front, consumer prices in the U.S. matched expectations rising 0.2% on the month in February, but the increase was slower compared to January's gain of 0.5%. The annual CPI was seen rising to 2.2% from 2.1% as expected while core inflation rate was steady at 1.8%.
Developments on Brexit also dominated the news wires as the EU President Jean-Claude Junker and the chief negotiator Barnier were seen turning up the heat on the negotiations just a week before the EU conference. They asked UK to come up with solutions on the Irish border. The UK also released the Spring statement with Chancellor Hammond giving an upbeat view. He also said that the cost of Brexit to the UK's economy was estimated to be 38 billion GBP.
Looking ahead, the ECB President Mario Draghi will be speaking at the ECB Watchers conference which could be a key event risk for the euro currency. Retail sales from the U.S. will be released later in the day and is expected to rise 0.3% on the month, reversing the declines from January.
EUR/USD intra-day analysis

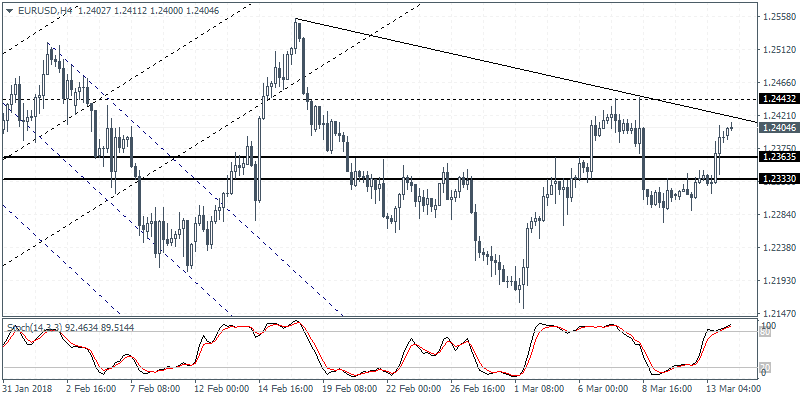
EUR/USD (1.2404):The EUR/USD was seen posting strong gains on the day led by the developments from Washington that weakened the USD. The euro edged back higher above the 1.2365 level of resistance. Price action continues to remain choppy. To the upside, the currency pair could be seen testing the short term falling trend line alongside horizontal resistance level near 1.2443. A breakout above this level could put EUR/USD back to the upside. However, failure to breakout from the trend line could keep the common currency trading sideways.
GBP/USD intra-day analysis

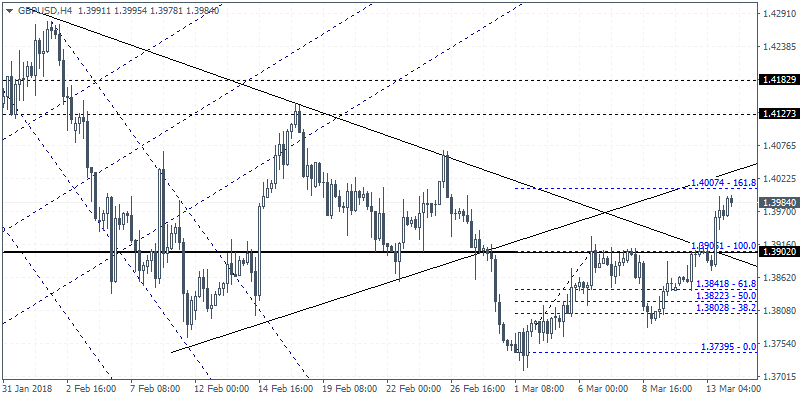
GBP/USD (1.3984):The British pound managed to maintain its gains as price action was seen breaking past the 1.3902 level of resistance. The upside momentum could see the currency pair likely to slip back to establish support at 1.3902. The upside move also invalidates the symmetrical triangle pattern. However, we expect that the near term gains could be capped alongside the trend line. With the resistance level of 1.3902 giving way, we expect GBP/USD to test 1.4000 level validating the bullish triangle pattern.
XAU/USD intra-day analysis

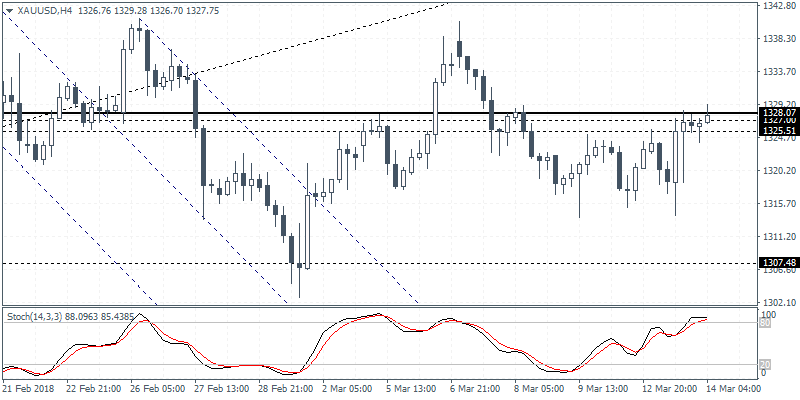
XAU/USD (1327.75): Gold prices remained subdued but managed to post gains on the day. Price action is seen testing the resistance level at 1328. A breakout to the upside above this level could keep gold prices to potentially aim for the previous highs established around 1337 level. However, it is ideal to wait for gold prices to breakout and then retest the 1328 region to establish support. This could potentially confirm the upside bias. Alternately, we expect gold prices to maintain the sideways range within the 1328 and 1307 region.
