The U.S. dollar continued to extend the declines from last week. Economic data was sparse and the weaker greenback sent the euro higher on the day. The gains came as signs of easing global trade tensions brought about a risk on sentiment in the market.
President Trump said that the U.S. had agreed to a new trade deal with Mexico to replace the North American Free Trade Agreement (NAFTA).
The German Ifo business sentiment showed that the German economy was on par to post a 0.5% quarterly growth for Q3.
The European session is relatively quiet today. The private loans report is due to come out with forecasts pointing to a 3.0% increase. The NY trading session will see the release of the U.S. goods trade balance followed by the preliminary wholesale inventories report. The data could potentially alter the expectations of the GDP revision for the second quarter.
Later in the evening, the Conference Board's consumer confidence report is due to show a modest decline to 126.6 from 127.4 previously. Regional manufacturing activity as measured by the Richmond Fed is forecast to show a decline to 18 from 20 a month ago.
EUR/USD intraday analysis

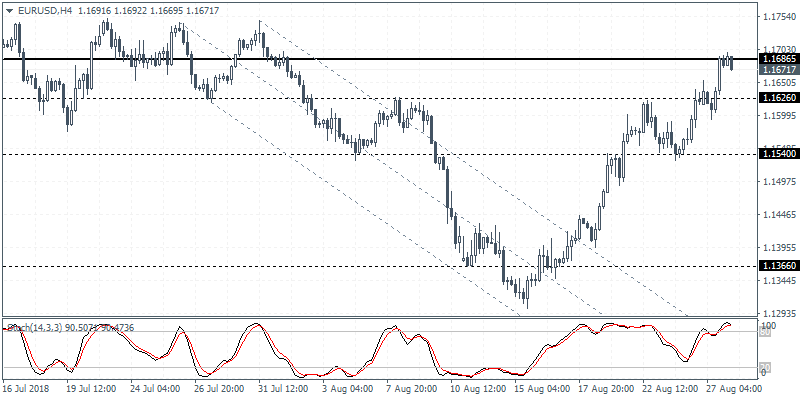
EUR/USD (1.1671):The euro currency extended the gains from last Friday as price action closed bullish following the bounce off the support level at 1.1540. Price action is seen trading at the resistance level of 1.1686 level by Monday's close. The strong gains posted is likely to see a near-term correction in price action. To the downside, the initial support is found at 1.1626. A break down below this level could trigger further declines to 1.1540 which is also pending a retest of support.
GBP/USD intraday analysis

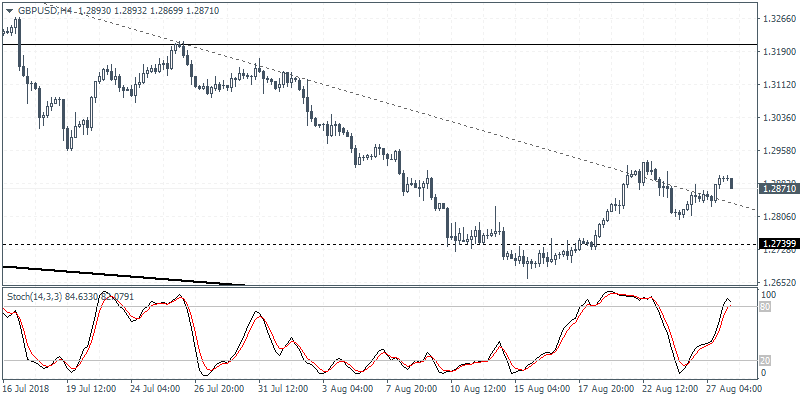
GBP/USD (1.2871):The British pound was seen posting gains for two consecutive days. However, price action is currently seen posting a lower high on the daily chart. This could potentially indicate a near-term correction. We expect price action to potentially retrace back to the previously established lows near 1.2806 level. In the event of a close below this low, GBP/USD could trigger further declines as price action could retest the previous lows at 1.2740.
XAU/USD intraday analysis

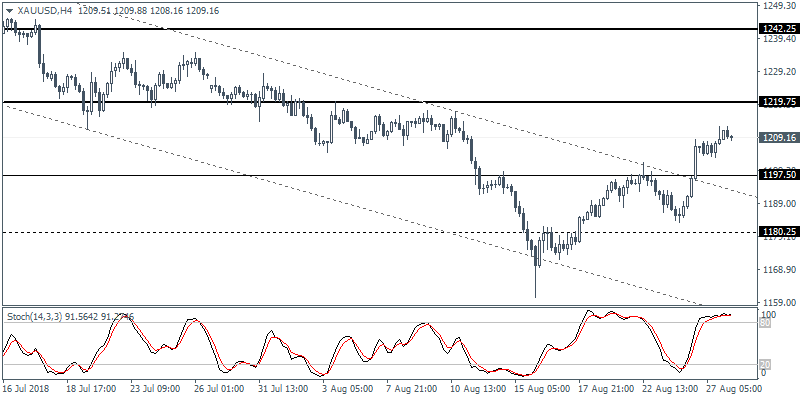
XAU/USD (1209.16):Price action in Gold is expected to eventually target the 1219.75 level of resistance. The strong gains, however, expose the precious metal to a potential dip toward 1197.50. Establishing support at this level could signal a continuation to the upside. However, in the event that gold prices break down below the support level, we expect to see price action testing the lower support at 1180.75. To the upside, a breakout above 1219.75 will see further gains extending toward 1242.25.
