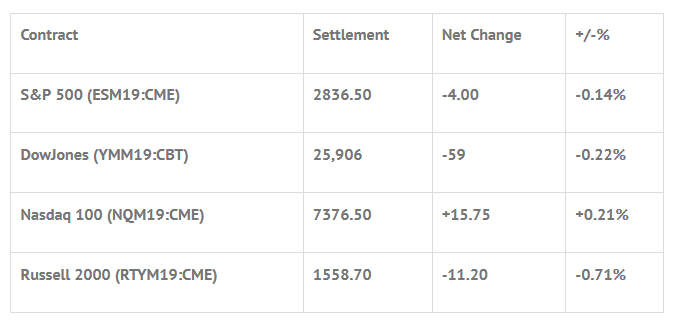
Index Futures Net Changes and Settlements:

Foreign Markets, Fair Value and Volume:
- In Asia 9 out of 11 markets closed lower: Shanghai Comp -0.01%, Hang Seng -0.49%, Nikkei +0.20%
- In Europe 11 out of 13 markets are trading lower: CAC -0.13%, DAX -1.24%, FTSE -0.02%
- Fair Value: S&P +5.58, NASDAQ +30.26, Dow +31.55
- Total Volume: 1.48mil ESM & 399 SPM traded in the pit
Today’s Economic Calendar:
Today’s economic calendar includes MBA Mortgage Applications 7:00 AM ET, EIA Petroleum Status Report 10:30 AM ET, FOMC Meeting Announcement 2:00 PM ET, FOMC Forecasts 2:00 PM ET, and the Fed Chair Press Conference 2:30 PM ET.
S&P 500 Futures: #ES 2858 As China Balks On Intellectual Property

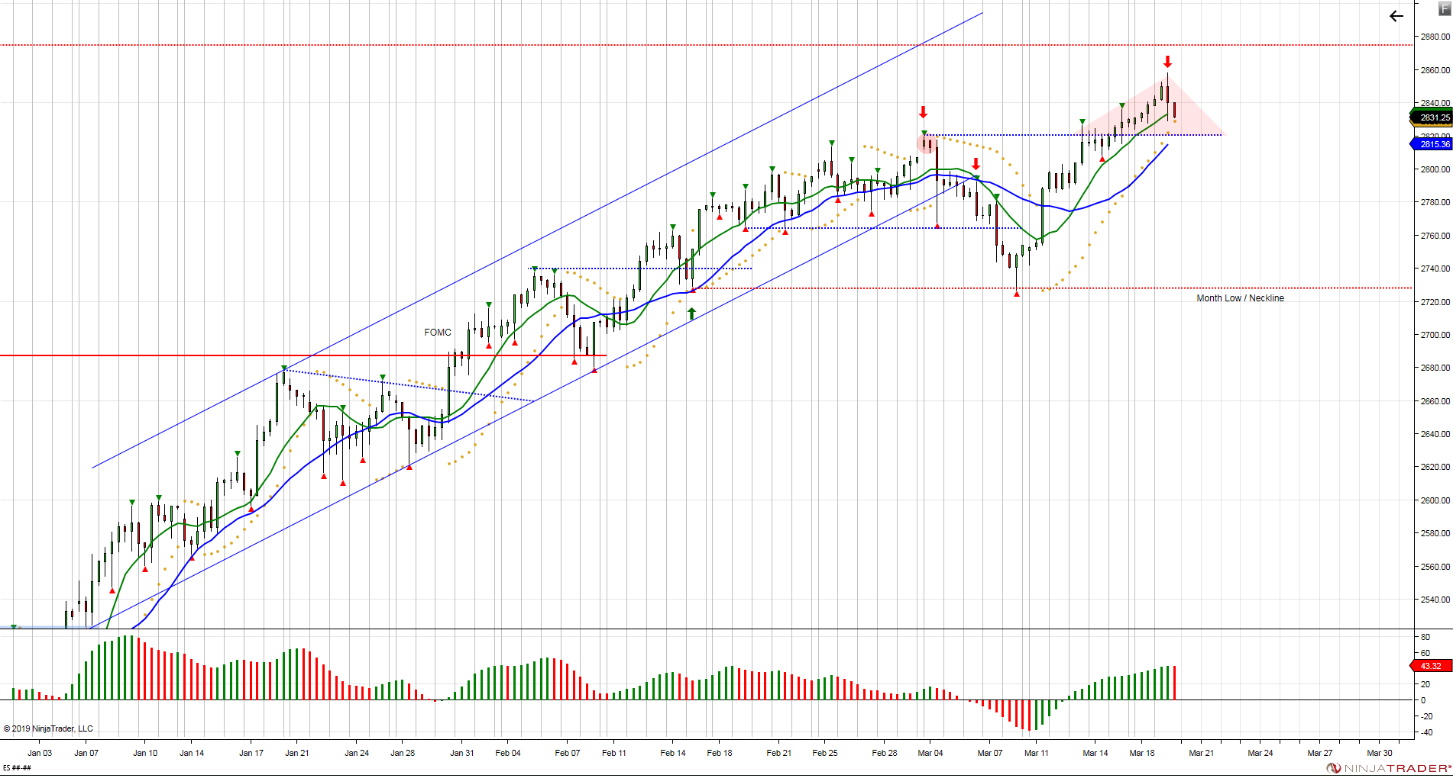
Chart courtesy of Stewart Solaka @Chicagostock – $ES_F U turn, followed by inclining handle. = Force buyers to chase vs buying p/b. Risk of bull trap >2820 on failure to hold. 2760-2740 support range for buyers to defend month low. Month low 2729= neckline.
During Monday nights Globex session, the S&P 500 futures (ESM19:CME) printed a high of 2853.00, a low of 2839.25, and opened Tuesday’s regular trading hours at 2849.75. After the bell, the ES spent the first 90 minutes of the session toggling back and forth in a 6 handle range, with very little volume traded.
Just before 10:00 CT we finally saw some movement when the futures took a shot at the RTH low and traded down to 2844.50. The selling pressure was short lived though, and the ES turned around to set its sights on the highs. By 11:00 it had ripped higher, eventually topping out at 2858.75, and then settled into a steady grind back down.
At 11:45 CT a news headline hit the tape that China was walking back on trade offers, and the ES dropped 12 points in less than a minute, but quickly recovered, and just a few minutes later was trading back up at 2851.75. From there, the futures slowly drifted back down to 2842.00, and found support there.
Heading into the final hour, the ES had traded back up to 2848.75, and quickly turned around to take another shot at the lows. Heavy selling started coming in when the MiM came out showing over $1.5B to sell, and it didn’t stop until it bottomed out at 2829.00. After that, the futures spiked higher into the close and printed 2840.00 on the 3:00 cash close, and 2836.00 on the 3:15 futures close.
In the end, the overall tone of the ES was strong early in the day and week later in the day. In terms of the days overall trade, total volume was higher, with 1.48 million futures contracts traded.
Disclaimer: Trading Futures, Options on Futures, and retail off-exchange foreign currency transactions involves substantial risk of loss and is not suitable for all investors. You should carefully consider whether trading is suitable for you in light of your circumstances, knowledge, and financial resources. Any decision to purchase or sell as a result of the opinions expressed in the forum will be the full responsibility of the person(s) authorizing such transaction(s). BE ADVISED TO ALWAYS USE PROTECTIVE STOP LOSSES AND ALLOW FOR SLIPPAGE TO MANAGE YOUR TRADE(S) AS AN INVESTOR COULD LOSE ALL OR MORE THAN THEIR INITIAL INVESTMENT. PAST PERFORMANCE IS NOT INDICATIVE OF FUTURE RESULTS.
