On Thursday, the Conference Board released the latest leading and coincident economic indicators. There are two reasons there are some of my favorite statistics.
First, they organize 14 economic indicators in an easy-to-understand format. Second, they have a long history of accurately predicting the overall pace of growth. A combined reading of the Conference Board’s LEI/CEI release and the long leading indicators points to an economy that will continue to grow mildly for the foreseeable future.
The Long Leading Indicators
There are four leading indicators, starting with corporate profits and M2’s Y/Y growth.
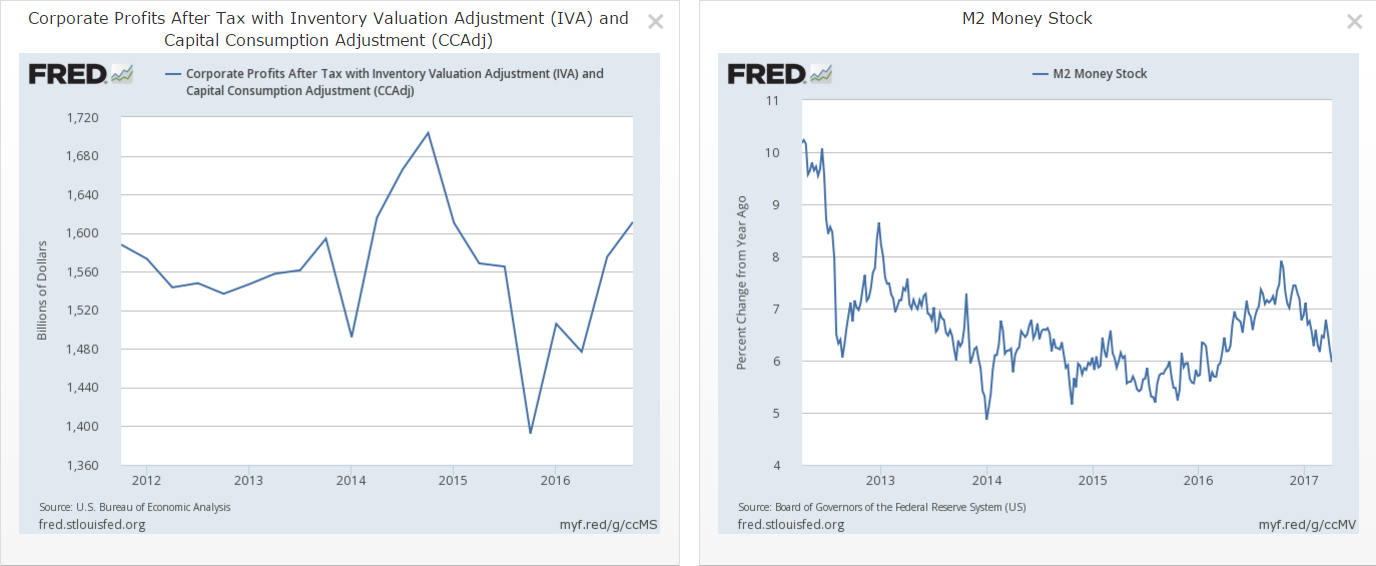
Starting in mid-2014, corporate profits (left chart) declined for four consecutive quarters. This drop’s damage – which was caused by OPECs opening of the production spigot in an attempt to drive American fracking companies out of the market -- was contained within two sectors: Oil and basic materials. But since oil’s price stabilization, energy profits have rebounded, contributing to macro-level corporate profit increases in three of the last four quarters. In addition, M2 (right chart) continues to grow at a solid pace, indicating there is ample liquidity for the economy.
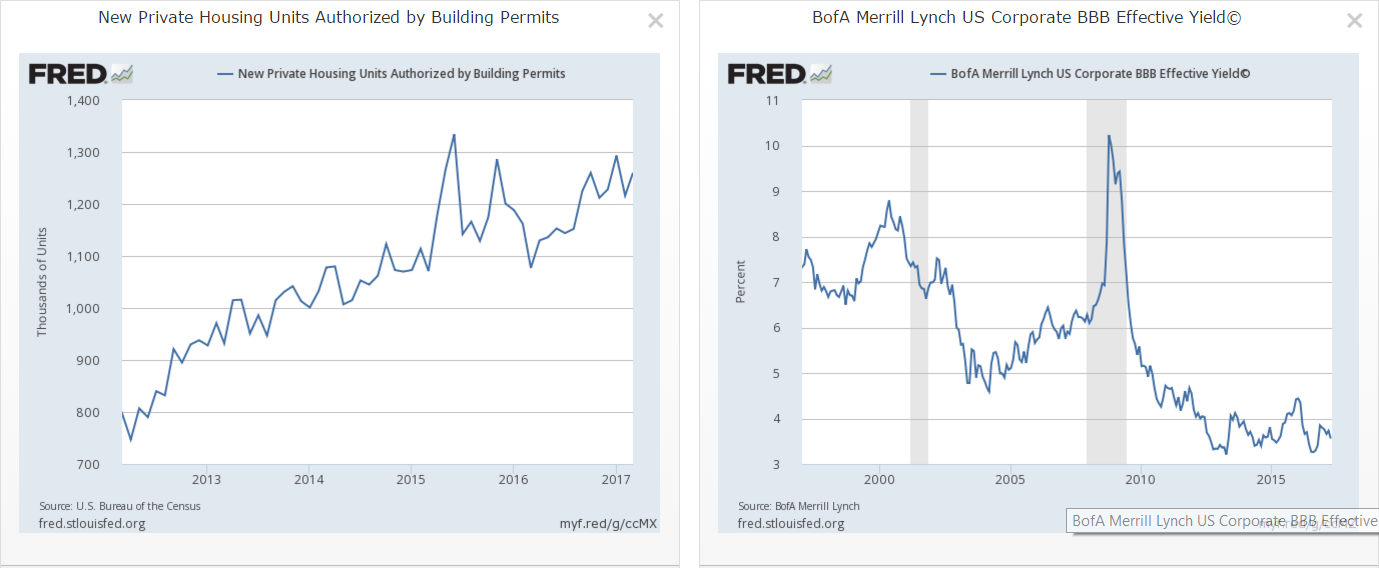
Building permits (left graph) are in a mini-uptrend that started at the beginning of 2016. However, the overall level of permit activity has fluctuated between 1.1 and 1.3 million since mid-way through 2015. BBB bond yields (right chart) are still trading near the low-end of the post 2009 range, indicating investors still believe these lower-rate companies are still worthwhile investments.
The Leading Indicators
The LEIs Rose .4% M/M and were up 2.4% on a rolling, 6-month basis. The best part, however, is the breadth of the advance:
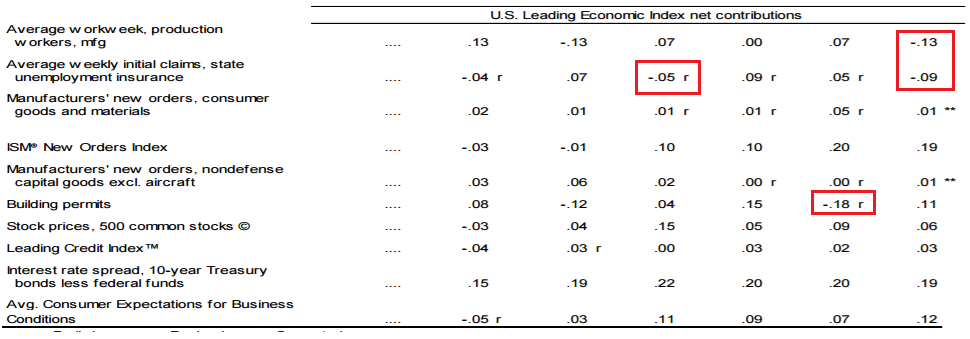
In the last four months, the smallest number of components that have increased is eight. This means each component is helping to move the economy forward – a healthy development.
The Coincident Indicators
The following graph shows the five most important coincident indicators:
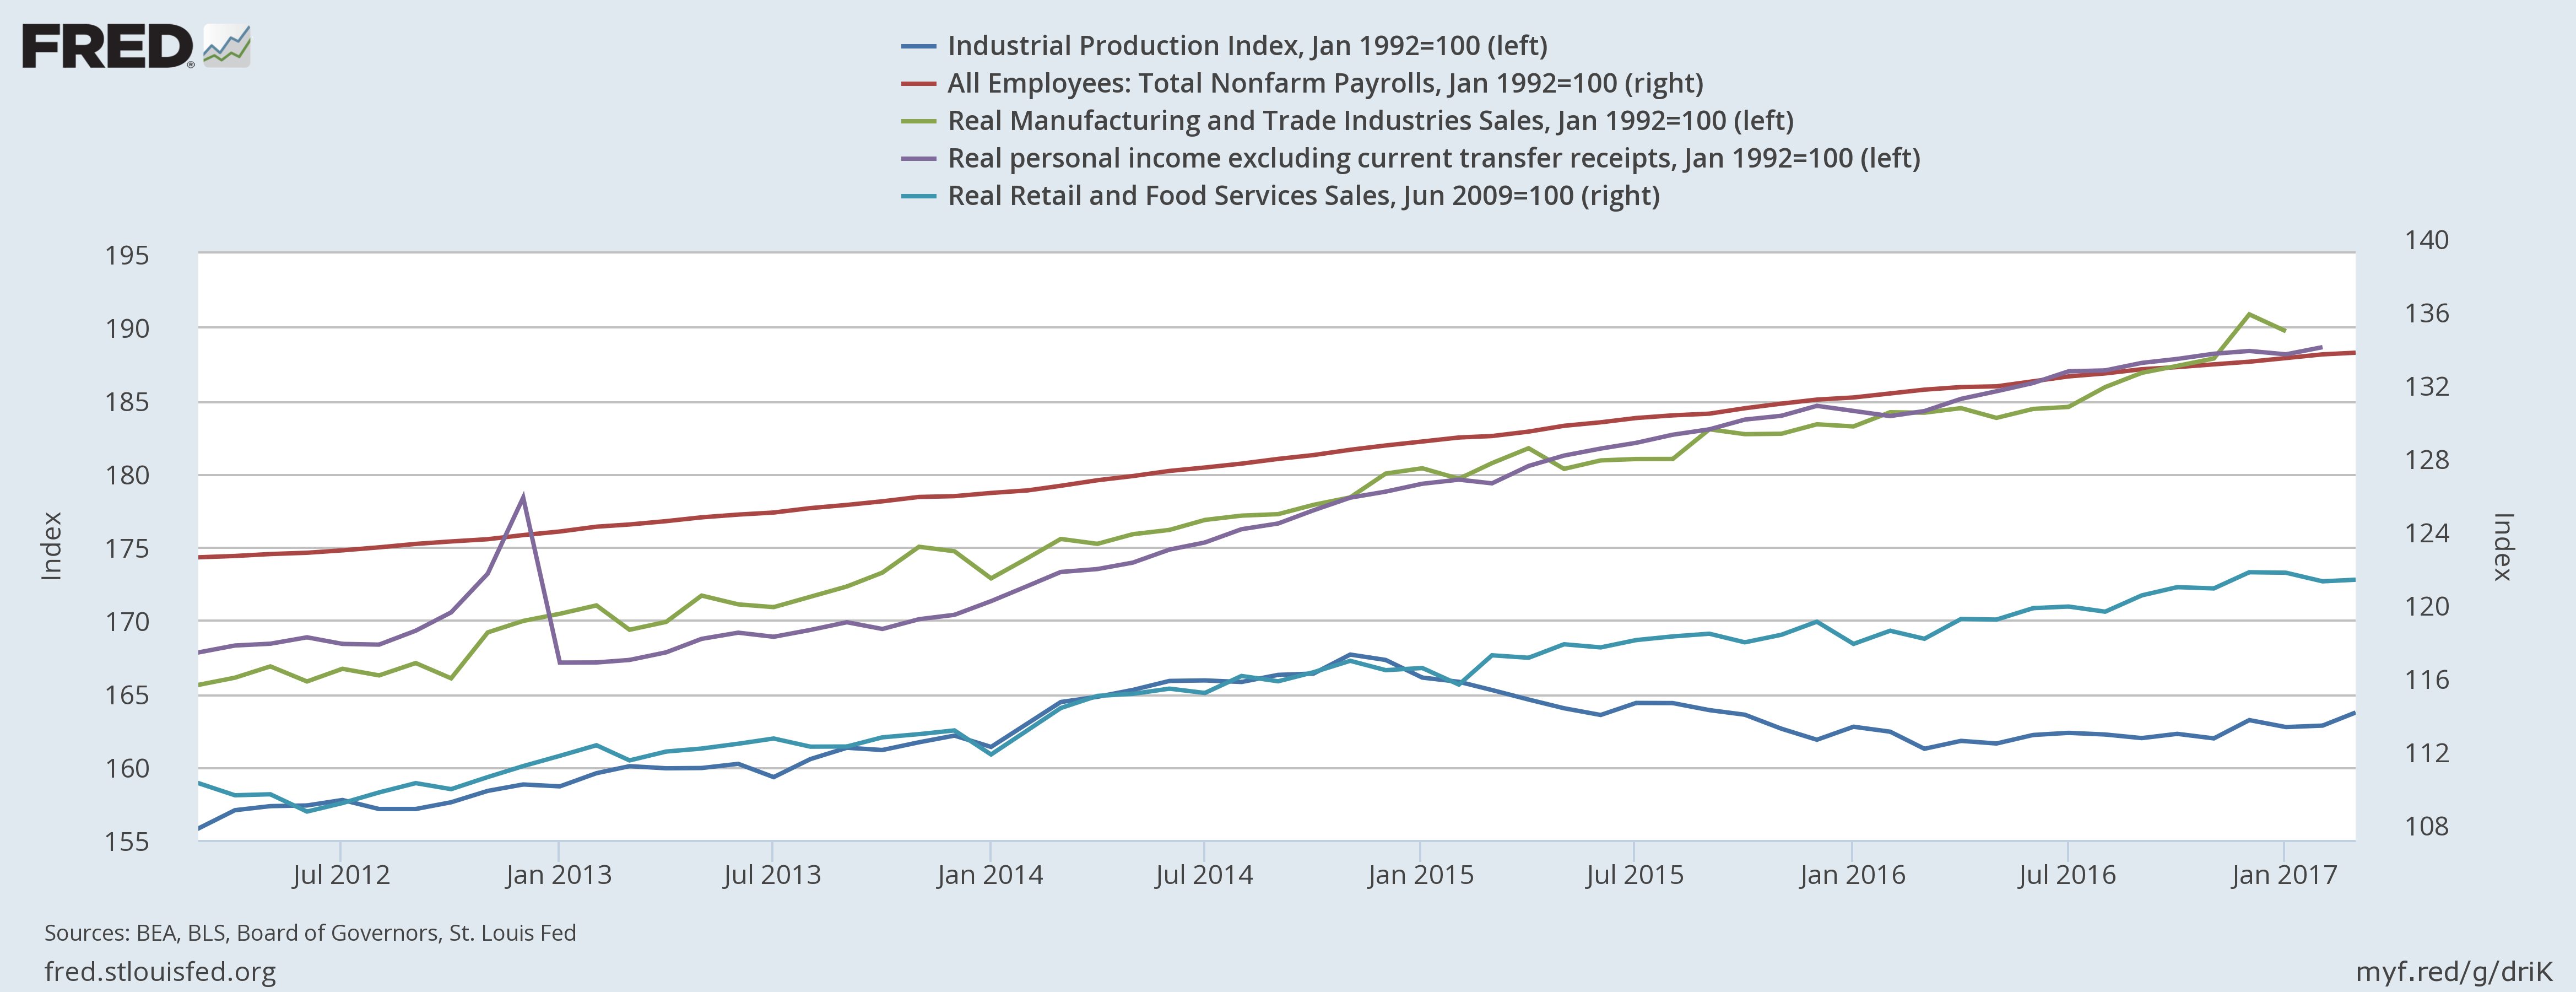
Two (real retail sales in blue and total payrolls in red) are scaled on the right side; the remaining three are on the left. All are scaled to 100, with the last month of the recession setting the base. Four of the five are in solid uptrends. Industrial production – the only laggard – fell due to oil’s price decline. It has since picked up a bit.
Economic Conclusion: The combined reading of the long-leading, leading and coincident indicators points to continued moderate growth. Corporate profits have picked-up, which may support a modest pick-up in hiring. The housing market is stable. The breadth of increases in the LEIs indicates modest growth in the next 6-9 months. And the coincident numbers point to more of the same.
Market Overview: As I noted last week, the “Trump trade” is winding down. After the election, traders purchased equities, believing that a unified Republican government would lead to lower taxes, less regulation and $1 trillion in new infrastructure investment. It’s now become apparent these campaign promises will take a bit longer to materialize. Forward inflation expectations and the yield curve illustrate the best example of this development:
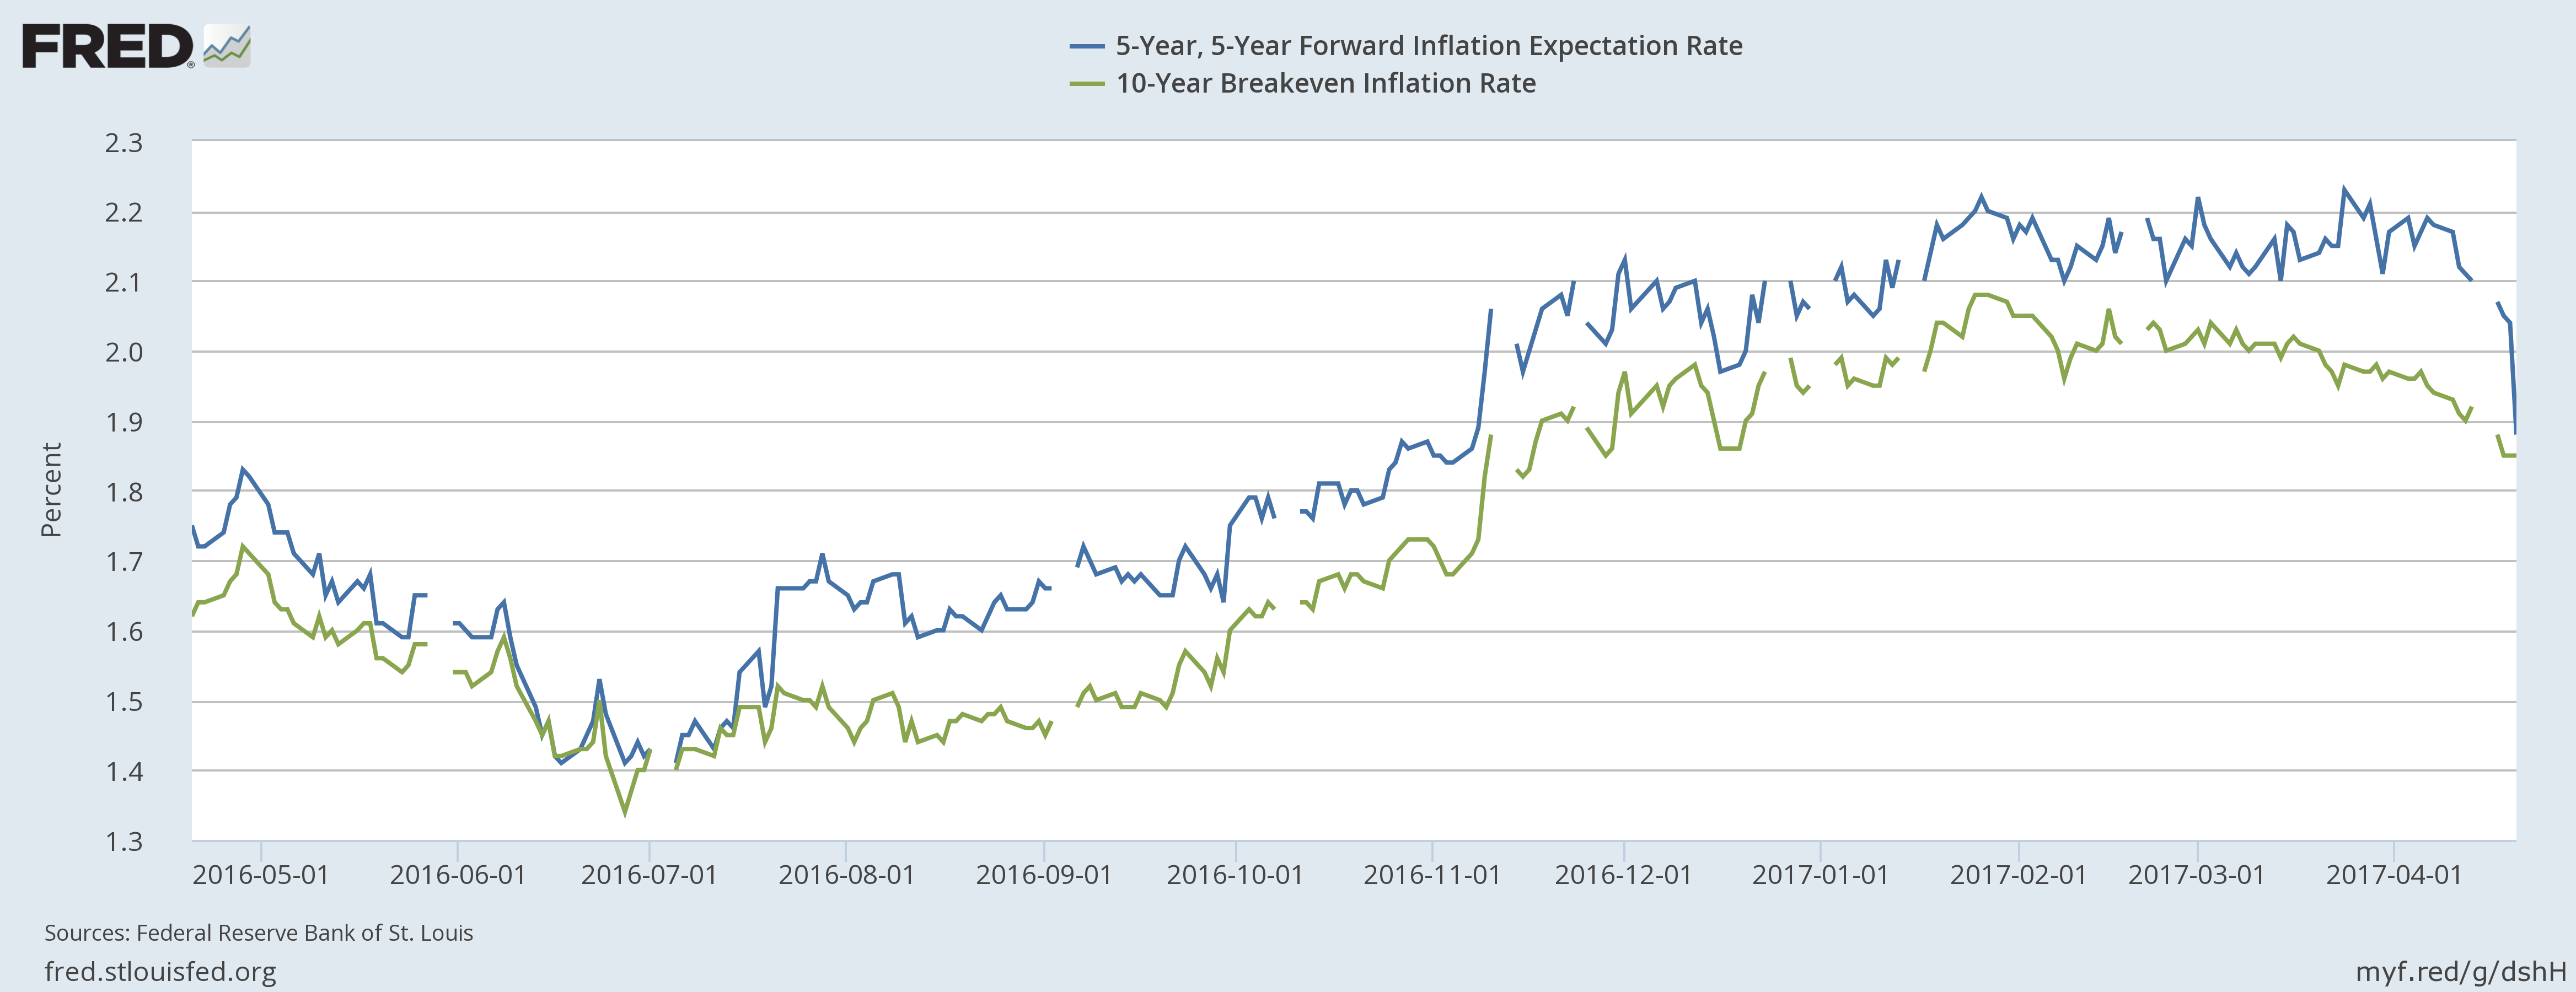
The above chart shows 5 and 10 year forward inflation rates. Both rose after the election and trended sideways for the 1Q 2017. But both have now declined, indicating traders no longer see increased inflation in the current environment. This has led to the belly of the yield curve tightening:
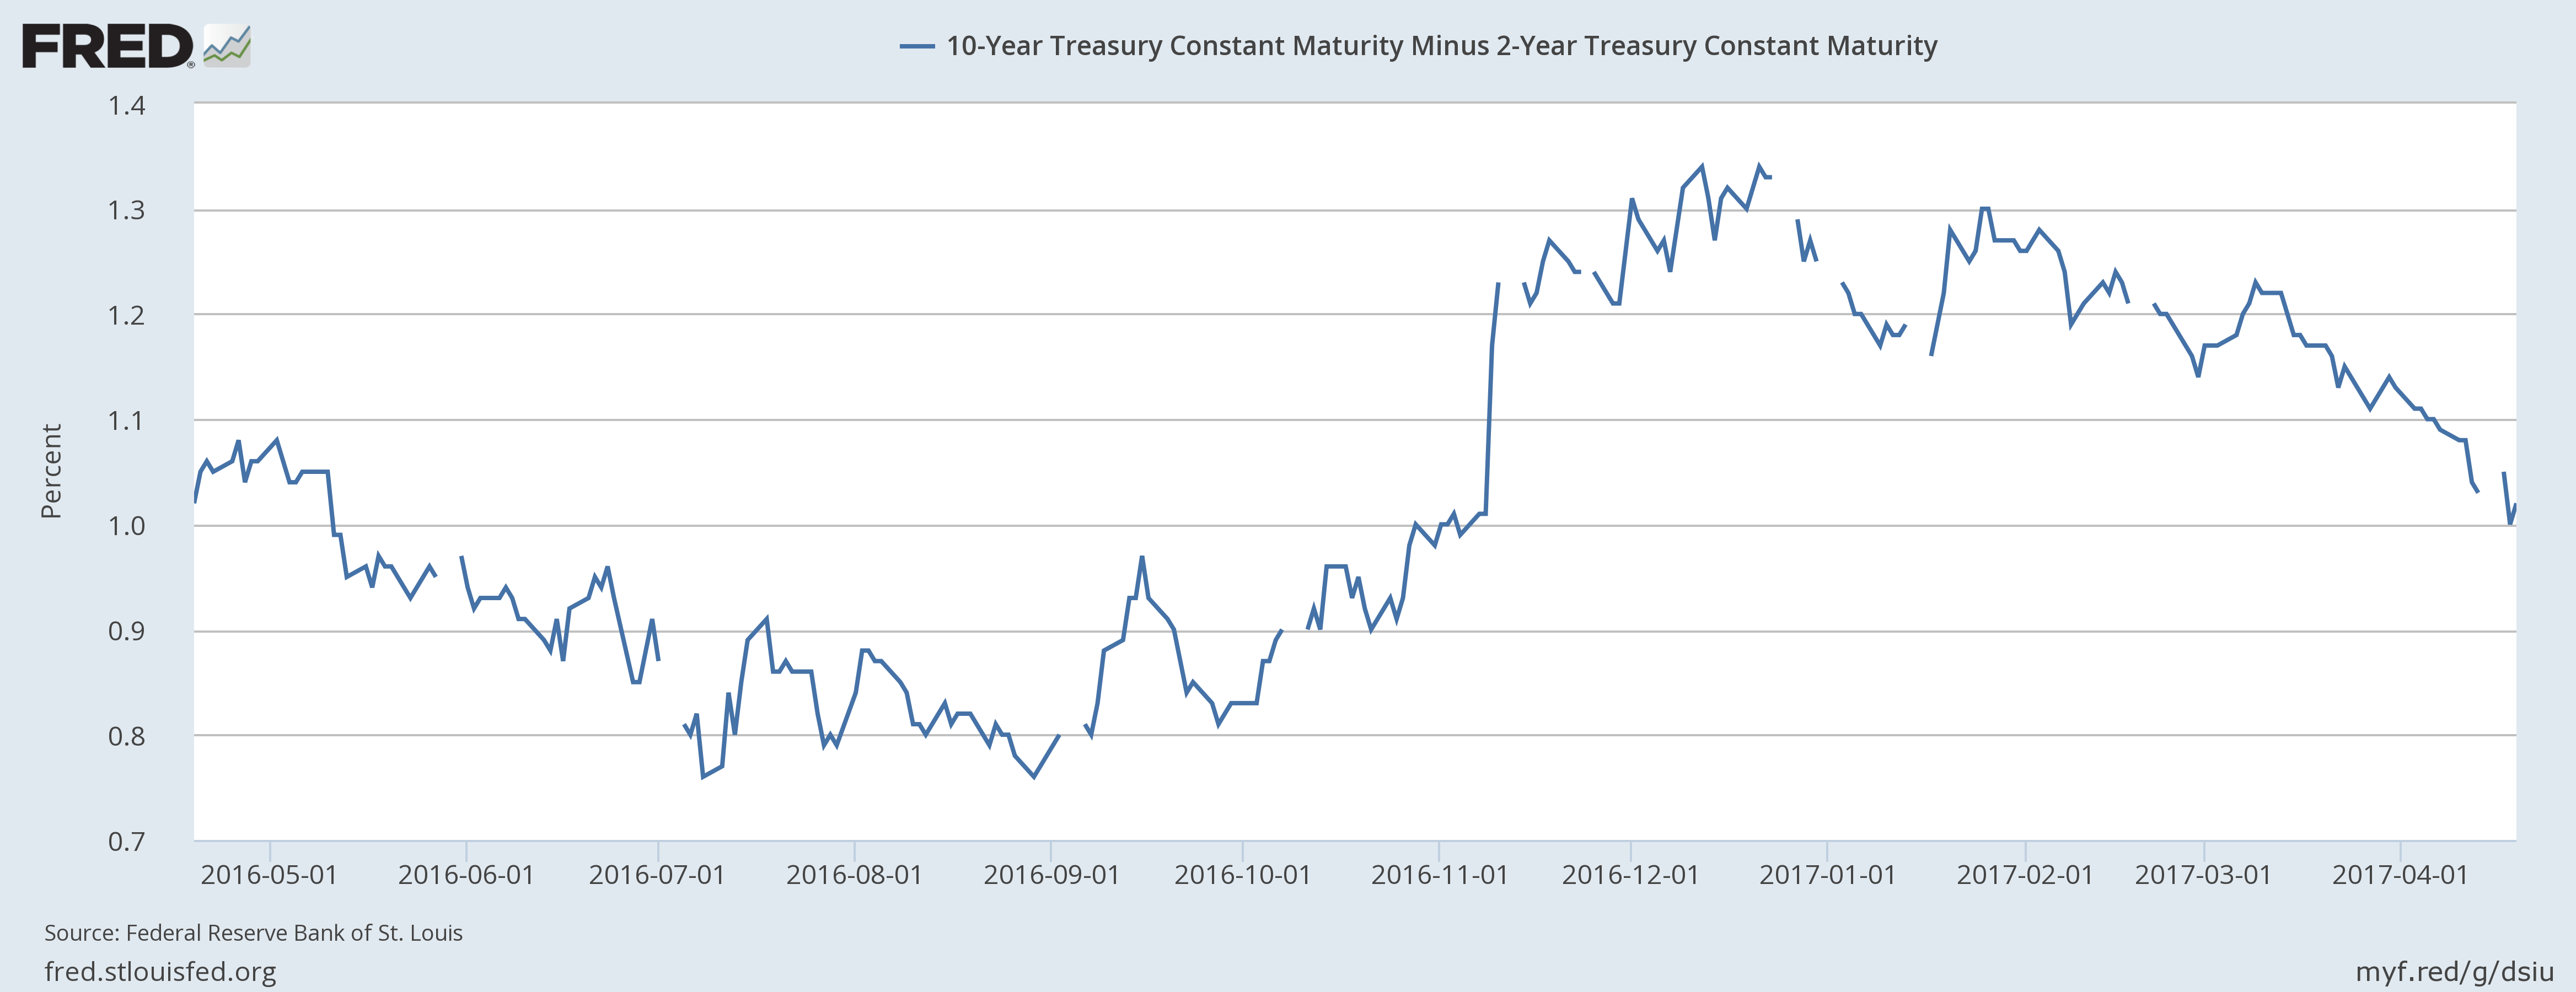
From its absolute post-election low to high, the 10-2 curve rose 56 basis points to 1.34%. But it now stands at 1.02, a 32 basis point tightening. And a rally in the long end of the curve is why:
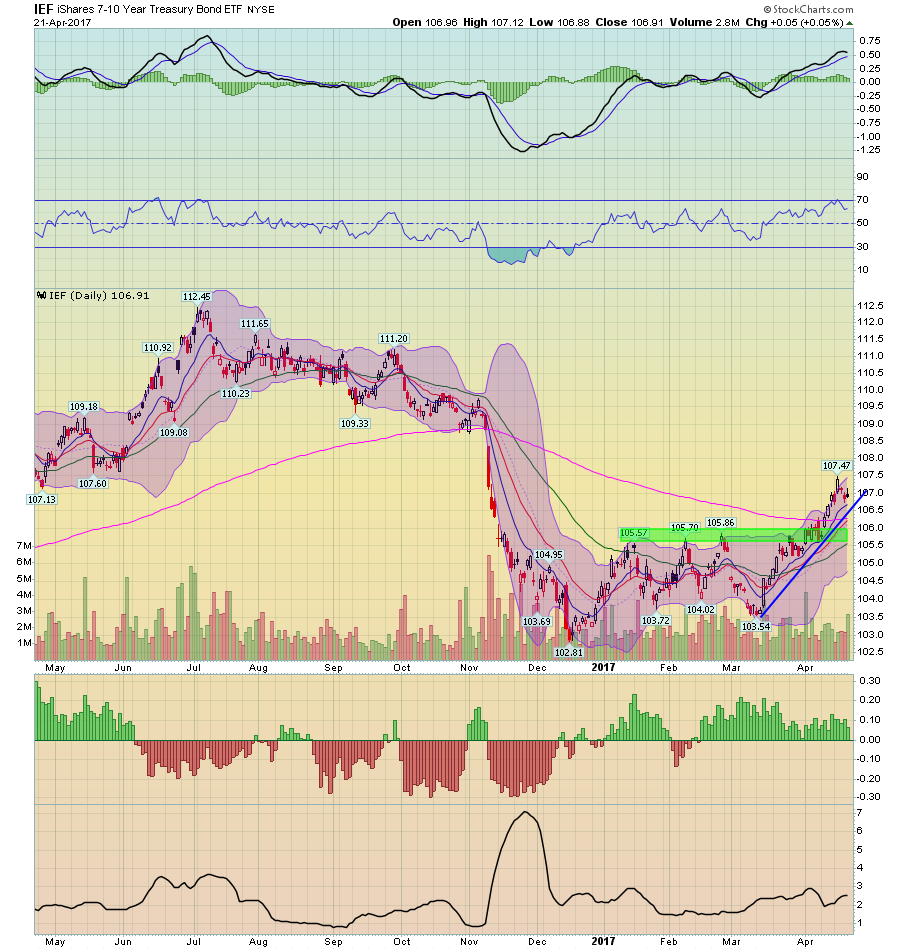
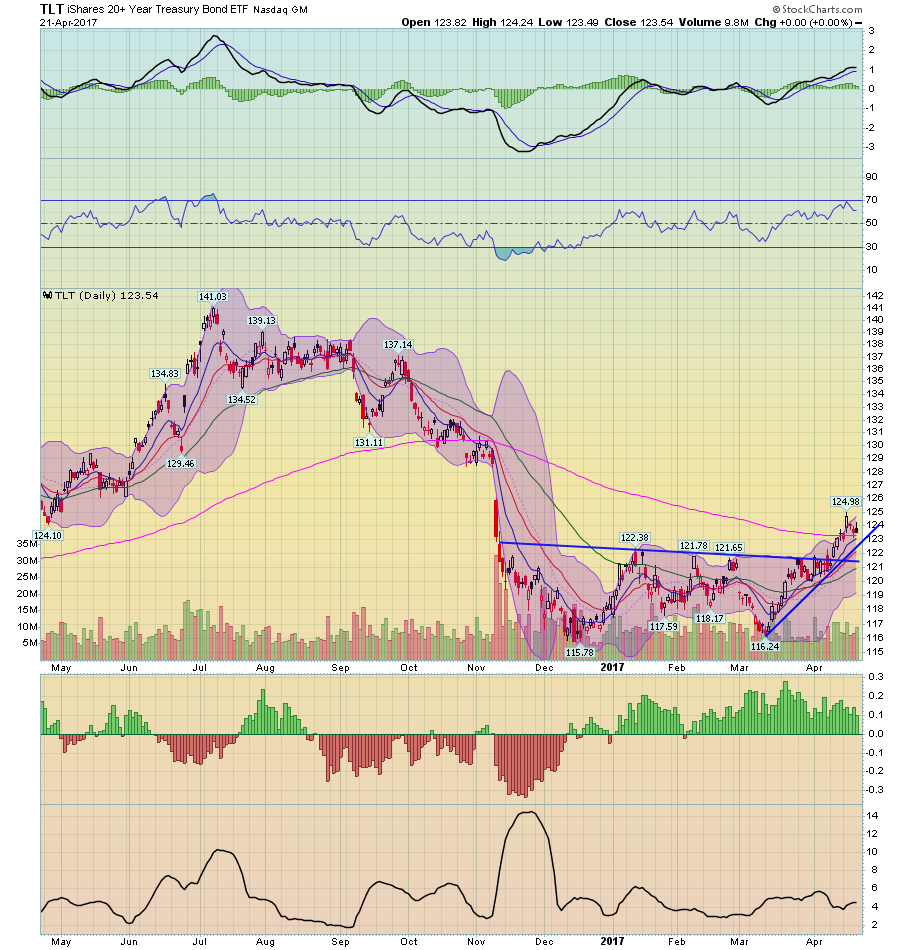
Since the beginning of the year, both of the above treasury ETFs (IEFs, top chart/TLT’s bottom chart) have moved through resistance.
This is not a monumental development; it’s best thought of as a moderate asset reallocation that’s been accompanied by profit taking in the equity market. To some extent, this is also a natural event: after rallying over 10%, it’s only natural for traders to take some money off the table by selling equity profits. And with the above information showing an economy that would support continued equity movement, a bear market is definitely a low probability.
