
The US dollar gained against all of its major counterparts yesterday and today in Asia, as US Treasury yields rose to a 14-month high. This forced investors to abandon tech-related stocks as higher yields lower their discounted present value.
As for today, the main event on the agenda may be Eurozone’s preliminary CPIs for March. However, we don’t expect the euro to gain much on a potential jump in headline inflation.
US Dollar Shines As Treasury Yields Hit A 14-Month High
The US dollar traded higher against all the other G10 currencies on Tuesday and during the Asian session Wednesday. It gained the most versus JPY, SEK, AUD, and NZD, while it eked out the least gains against NOK and CAD.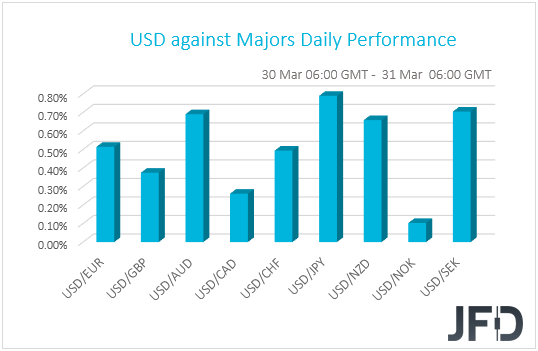
The strengthening of the dollar and the simultaneous weakening of the safe-haven yen and the risk-linked Aussie and Kiwi suggest that investors reduced their risk exposure due to another rise in bond yields. Indeed, although EU indices traded in the green, Wall Street closed in the red, with the soft appetite rolling into the Asian session today.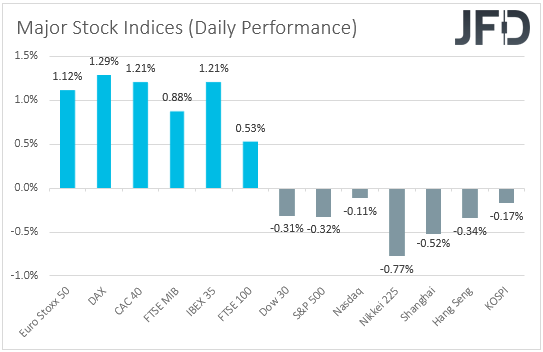
US Treasury yields hit a 14-month high, forcing investors to abandon tech-related stocks. High-growth tech companies are valued based on projected earnings years ahead, so higher yields lower their discounted present value. The opposite is true when yields fall. This also resulted in lower risk-linked currencies, like the Aussie and the Kiwi, but also a slide in the Japanese yen.
Despite its safe-haven status, the yen is feeling the heat of higher US Treasury yields because the BoJ has pledged to keep long-dated JGB yields near zero. That way, the yield-differential between the US and Japan continues to widen, and thereby, USD/JPY continues to march north. We believe that the yen is destined to continue to weaken either way. It could do so if yields continue to rise, but also if they pull back, as this may trigger a risk-on trading environment, which could encourage more yen selling due to its safe-haven status this time.
Overall, we still believe that any declines in equities may be a good opportunity for investors to buy at a lower price. We would consider any pullbacks as corrective moves and not reversals. We believe that with most major central banks suggesting that any spikes in inflation in the months to come are likely to prove to be temporary, inflation fears may ease again soon. Specifically, the Fed has clearly noted that they expect inflation to meet their goal in the years after 2023, while the dot plot from their latest gathering pointed to no rate hikes even during that year. Thus, with monetary policy expected to stay extra loose, we see the case for investors to re-increase their risk exposure at some point soon.
DJIA Technical Outlook
Last week, the Dow Jones Industrial Average index hit a new all-time high, at 33260, and then drifted lower. The index is still moving slightly lower, but because the index continues to trade above a short-term tentative upside support line drawn from the low of Mar. 4, this move lower could be classed as a temporary correction, before another possible move up. For now, we will take a somewhat positive approach.
A further small decline could bring the price to the 32868 support zone, marked by the low of Mar. 29, where the index might stall for a bit. If the bulls are happy to jump in there, DJIA could rise again, possibly making its way towards the current all-time high, at 3326. If that resistance area surrenders and breaks, this will confirm a forthcoming higher high and place the price into the uncharted territory.
On the other hand, a break of the previously mentioned upside line and a price-drop below the 32355 hurdle, marked by the low of Mar. 23, could spook the remaining bulls from the field, allowing more bears to join in. DJIA might then drift to last week’s low, at 32066, a break of which would confirm a forthcoming lower low, possibly clearing the way to the 31745 level, marked by the low of Mar. 10. Slightly below it lies another potential support area, at 31667, which is the high of Mar. 1.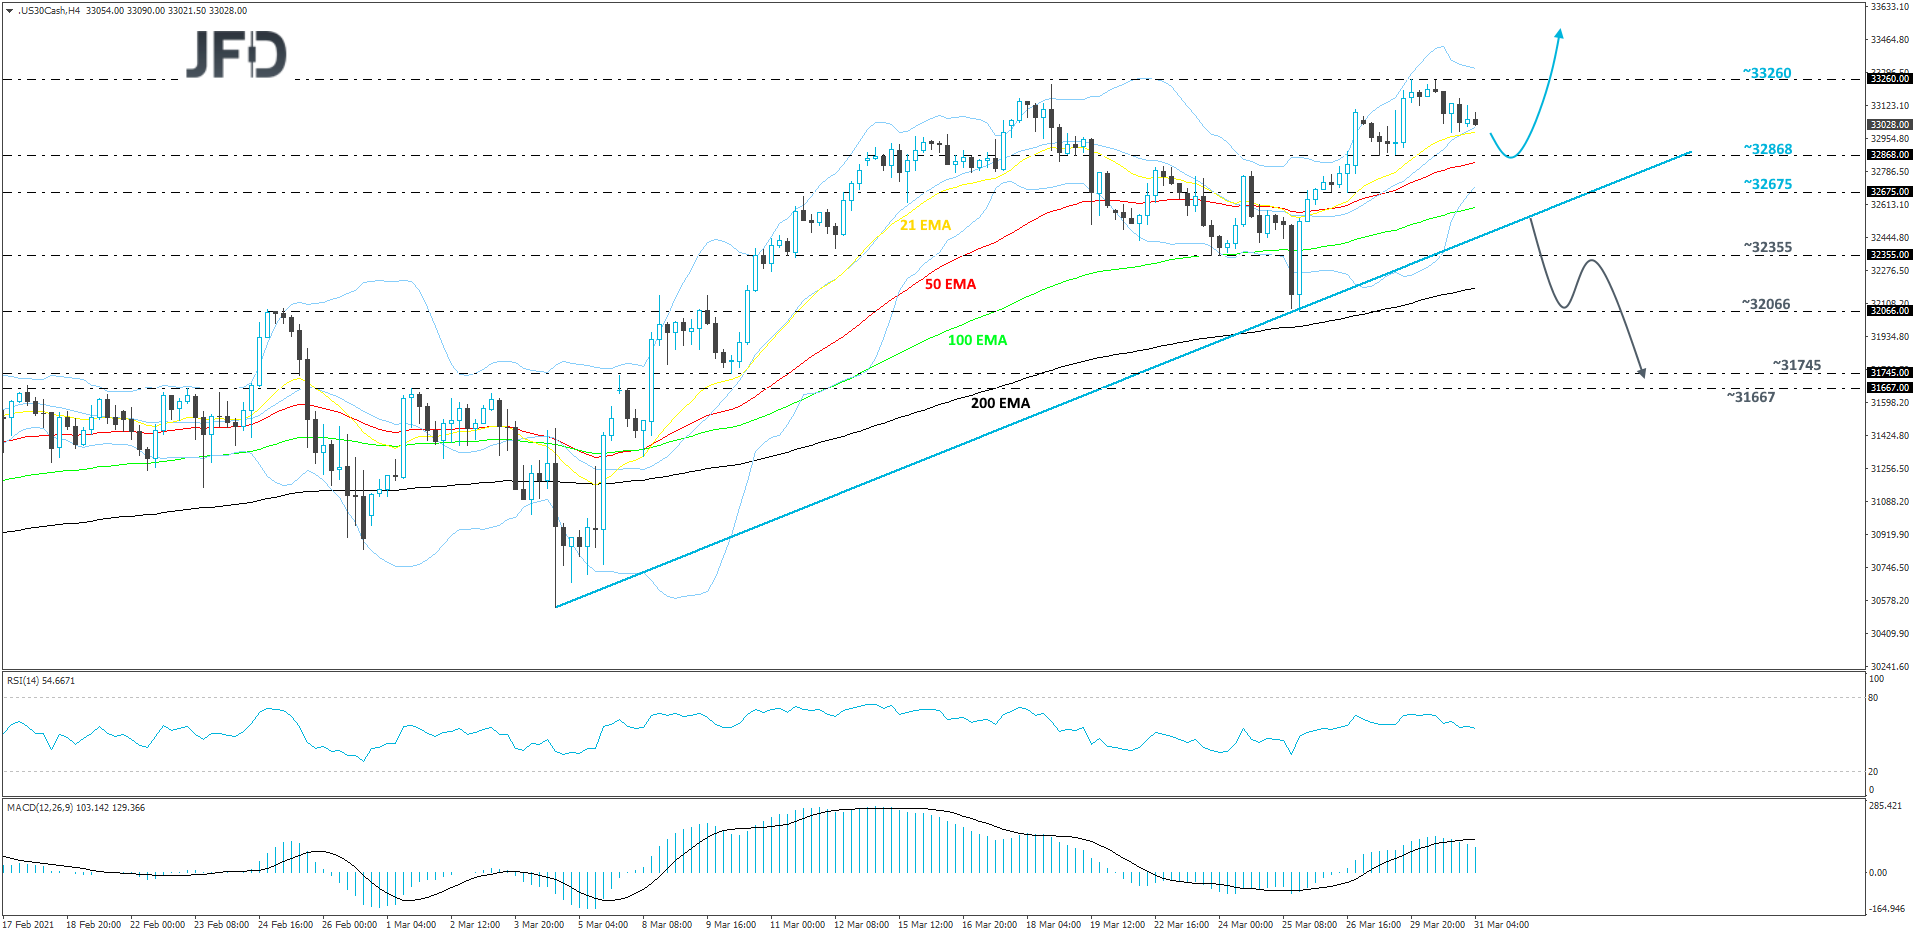
Higher Eurozone Inflation Unlikely To Boost The Euro
As for today, the main event on the economic agenda may be Eurozone’s preliminary CPIs for March. The headline CPI rate is expected to have risen to +1.3% yoy from +0.9%, while no forecast is available for the core rate. However, the HICP excluding energy and food rate is anticipated to have stayed unchanged at +1.2% yoy.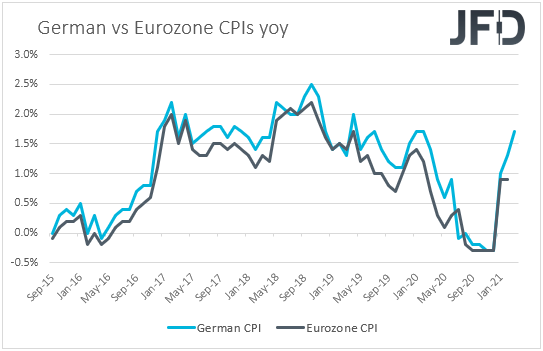
At its latest meeting, the ECB decided to accelerate its Pandemic Emergency Purchase Program in order to stop any unwarranted rise bond yields. Under normal circumstances, rising inflation may have lessened the likelihood for more easing by this Bank. However, with underlying inflation staying subdued and most officials around the globe suggesting that any spike in headline inflation in the months to come is likely to prove to be temporary, we see the case for the ECB to keep the door for more action wide open.
Therefore, we don’t expect the euro to gain much on a potential jump in headline inflation. On the contrary, due to the fresh lockdowns in the Eurozone, and the slow vaccination process in the bloc, we may see it extending its recent slide.
EUR/USD Technical Outlook
EUR/USD continues to drift lower, while trading below a short-term downside resistance line taken from the high of Feb. 25. Even if the rate does retrace back up a bit, but struggles to overcome that downside line, another slide could be possible. As long as that downside line stays intact, we will stay bearish with the near-term outlook.
Currently, the pair is finding good support near the 1.1704 hurdle, marked by the inside swing high of Oct. 30. If that area continues to hold for a while, EUR/USD might rebound and make its way higher, closer to the aforementioned downside line. If that line remains intact, the bears could take advantage of the higher rate and drive it lower. If this time the 1.1704 obstacle surrenders and breaks, this will confirm a forthcoming lower low, potentially setting the stage for a move to the 1.1603 level, marked by the lowest point of November 2020.
Alternatively, if the previously discussed downside line breaks and the rate climbs above the 1.1835 barrier, marked by the low of Mar. 9, that could spook the remaining bears from the field for a while, potentially opening the door for further advances. EUR/USD may then rise to the 1.1874 obstacle, or to the 1.1946 territory, marked by the high of Mar. 22, where a temporary hold-up might occur. If the buying doesn’t stop there, the next potential target could be at 1.1990, marked near the highs of Mar. 11 and 17.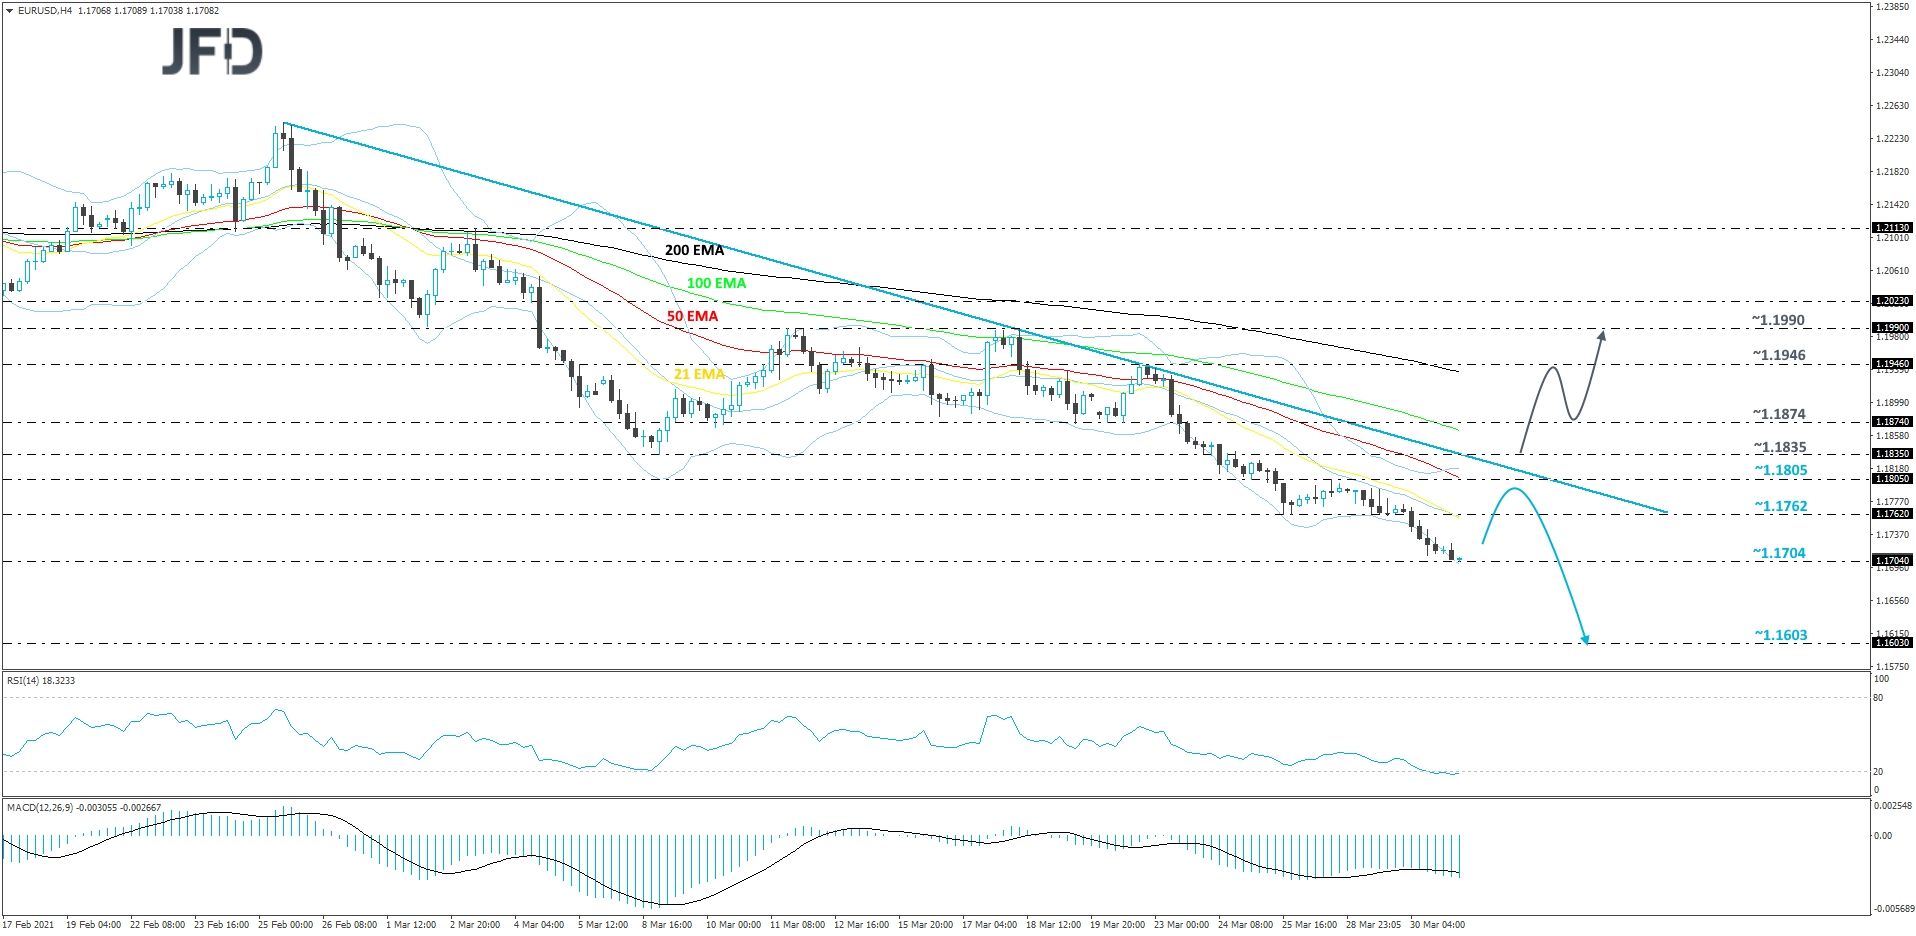
As For The Rest Of Today's Events
During the early European morning, we already got UK’s final GDP for Q4, which was revised up to +1.3% qoq from +1.0%.
Later in the day, besides Eurozone’s inflation data, we also get the US ADP employment report for March, as well as Canada’s monthly GDP for January.
The ADP report is forecast to show that the private sector has gained 525k jobs, much more than February’s 117k. This is likely to raise speculation that Friday’s NFPs may beat their own forecast of 182k. Canada’s GDP is expected to have accelerated to +0.5% mom from +0.1%.
Tonight, during the Asian session Thursday, Japan’s Tankan survey for Q1 is coming out. The Large Manufacturers index is expected to have declined to -15 from -10, while the Large Non-manufacturers index is anticipated to have held steady at -5. Australia’s trade balance and retail sales for February are also due to be released. Retail sales are forecast to have slid 1.1% mom after rising 0.5%, while the nation’s trade surplus is expected to have slightly declined.