Unnamed Sources and Oversupply:
Following on from the huge NFP beat last Friday, this week’s US calendar is relatively quiet. With only Unemployment Claims and Retail Sales to come, it doesn’t look like anything will shift sentiment back away from a December Fed hike. This of course will most notably affect the US dollar and see strength most likely continue through the week.
With the USD course back on track, traders are looking elsewhere for the best opportunities and an interesting Reuters article gave the euro bears something else to sink their teeth into.
The article is full of unnamed policymakers making calls about the size of Draghi’s impending cuts and accompanying expansion to the ECB’s stimulus program.
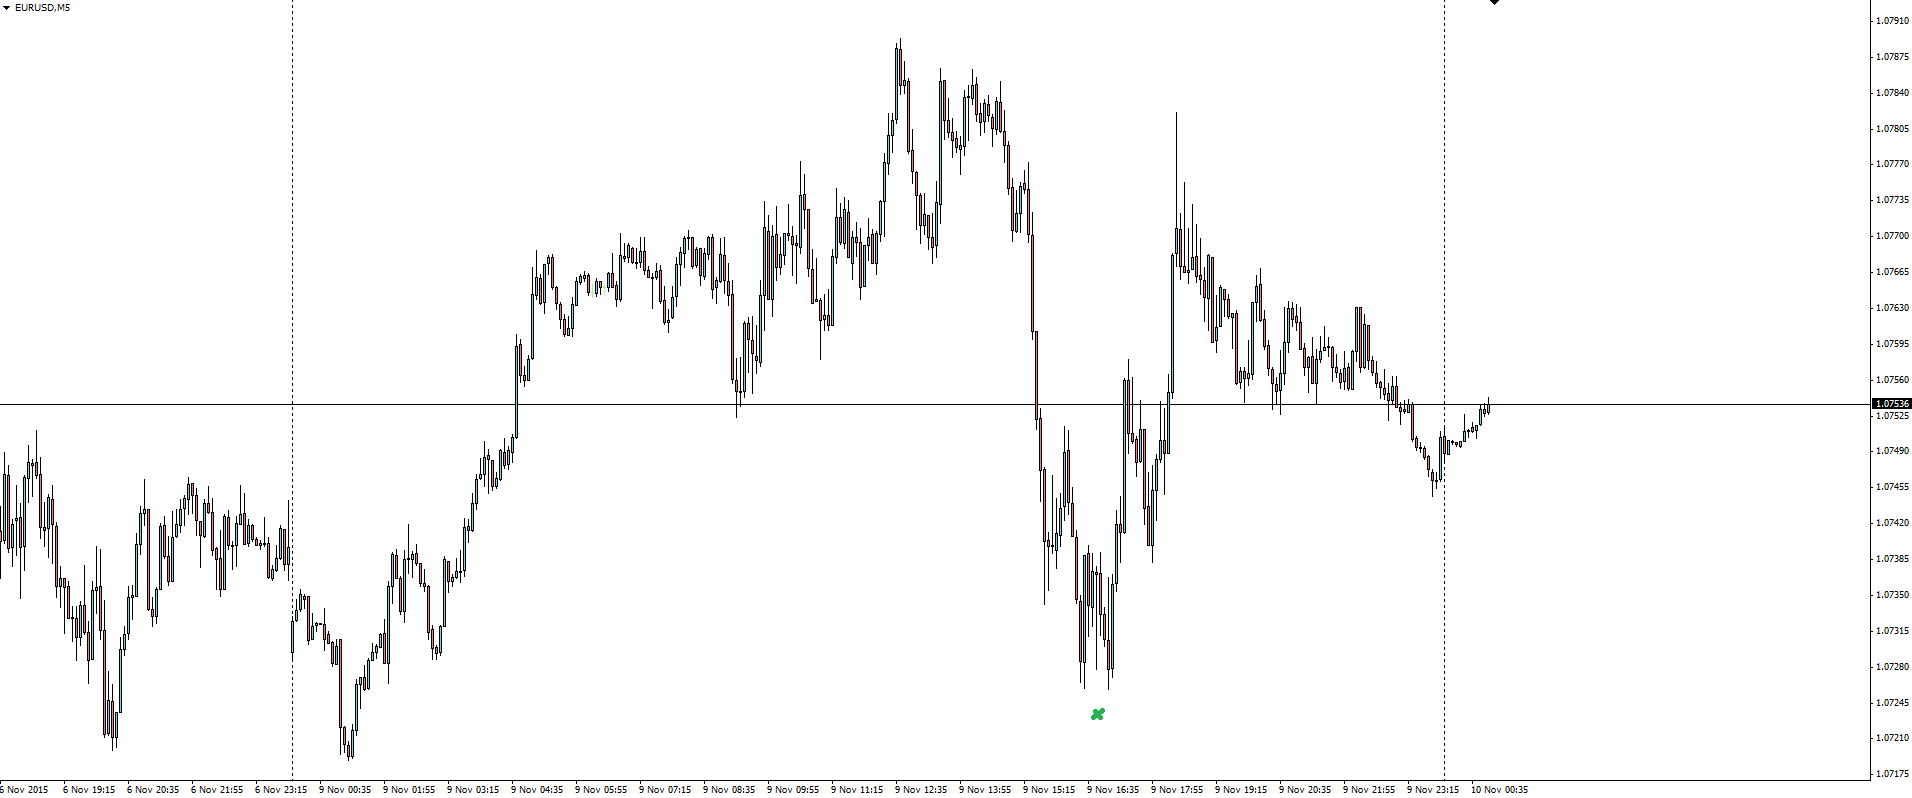
EUR/USD 5 Minute:
Click on chart to see a larger view.
As you can see on the EUR/USD 5 minute chart, any mention of unnamed sources causes whipsawing price action as the market realises that they very well could be trading something as good as a stock tip that they heard down the pub from that old guy who surely knows something…
“Let’s go for a big cut.”
“There is no bottom to the deposit rate in the near term, it could be lowered quite sharply still.”
Enjoy the volatility.
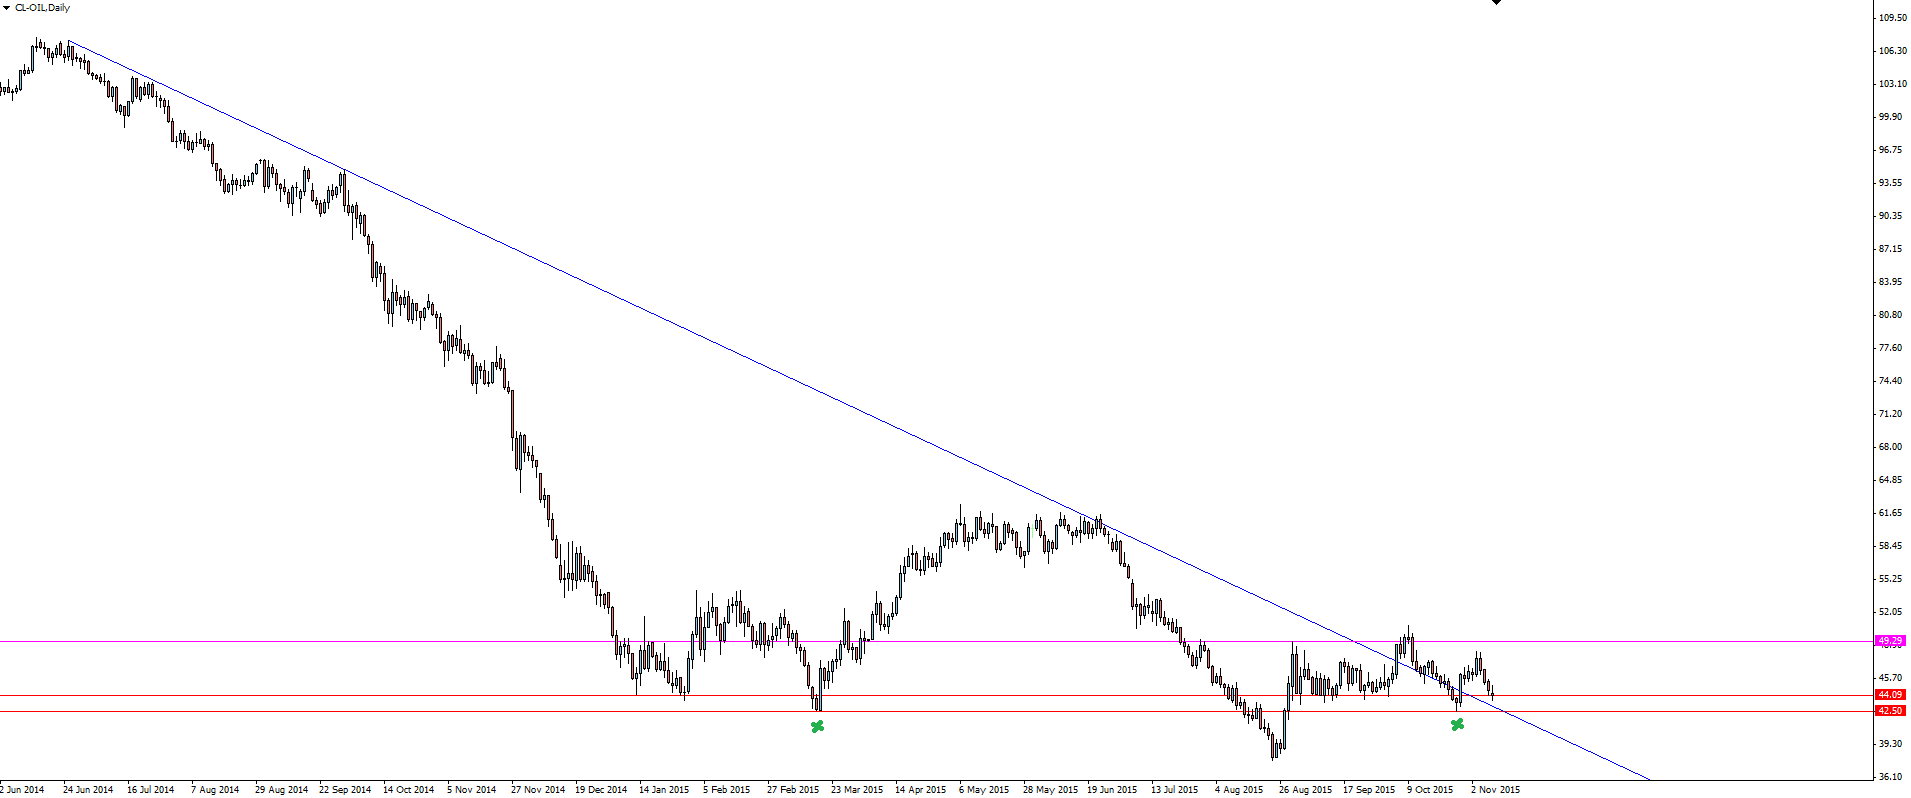
Elsewhere, oil continued to take a hit overnight, extending the commodity’s daily losses to 4 straight and pulling price back down into our marked technical support zone. Reasons given for the decline are the same oversupply issues (compare this rational to unnamed sources above and you’ll see a financial media pattern emerging) amid a milder than usual winter that is allowing for increased output.
OIL Daily:
Click on chart to see a larger view.
In these Daily Market Updates, I often talk about what happens when price breaks a trend line. Textbooks and pretty images posted and shared will show charts with clean trend line breakouts and equally clean re-tests. Looking at the OIL chart, we have a perfect case study to look at another real life example.
Price did break out of major trend line resistance, but was unable to sustain any sort of momentum and came back to re-test the level this time as support. From here, all we’ve seen is price hug the opposite side of the trend line in sideways trade.
With trend line support now lining up with the bottom of OIL’s short term horizontal range, could this spot see a reaction?
———
On the Calendar Tuesday:
AUD NAB Business Confidence
AUD Home Loans m/m
CNY CPI y/y
CNY PPI y/y
———-
Chart of the Day:
Yesterday we took a look at a possible SPI 200 short. After the weekend’s Chinese Trade Balance numbers pushing the government to continue down the path of monetary easing, we expected some weakness in the SPI.
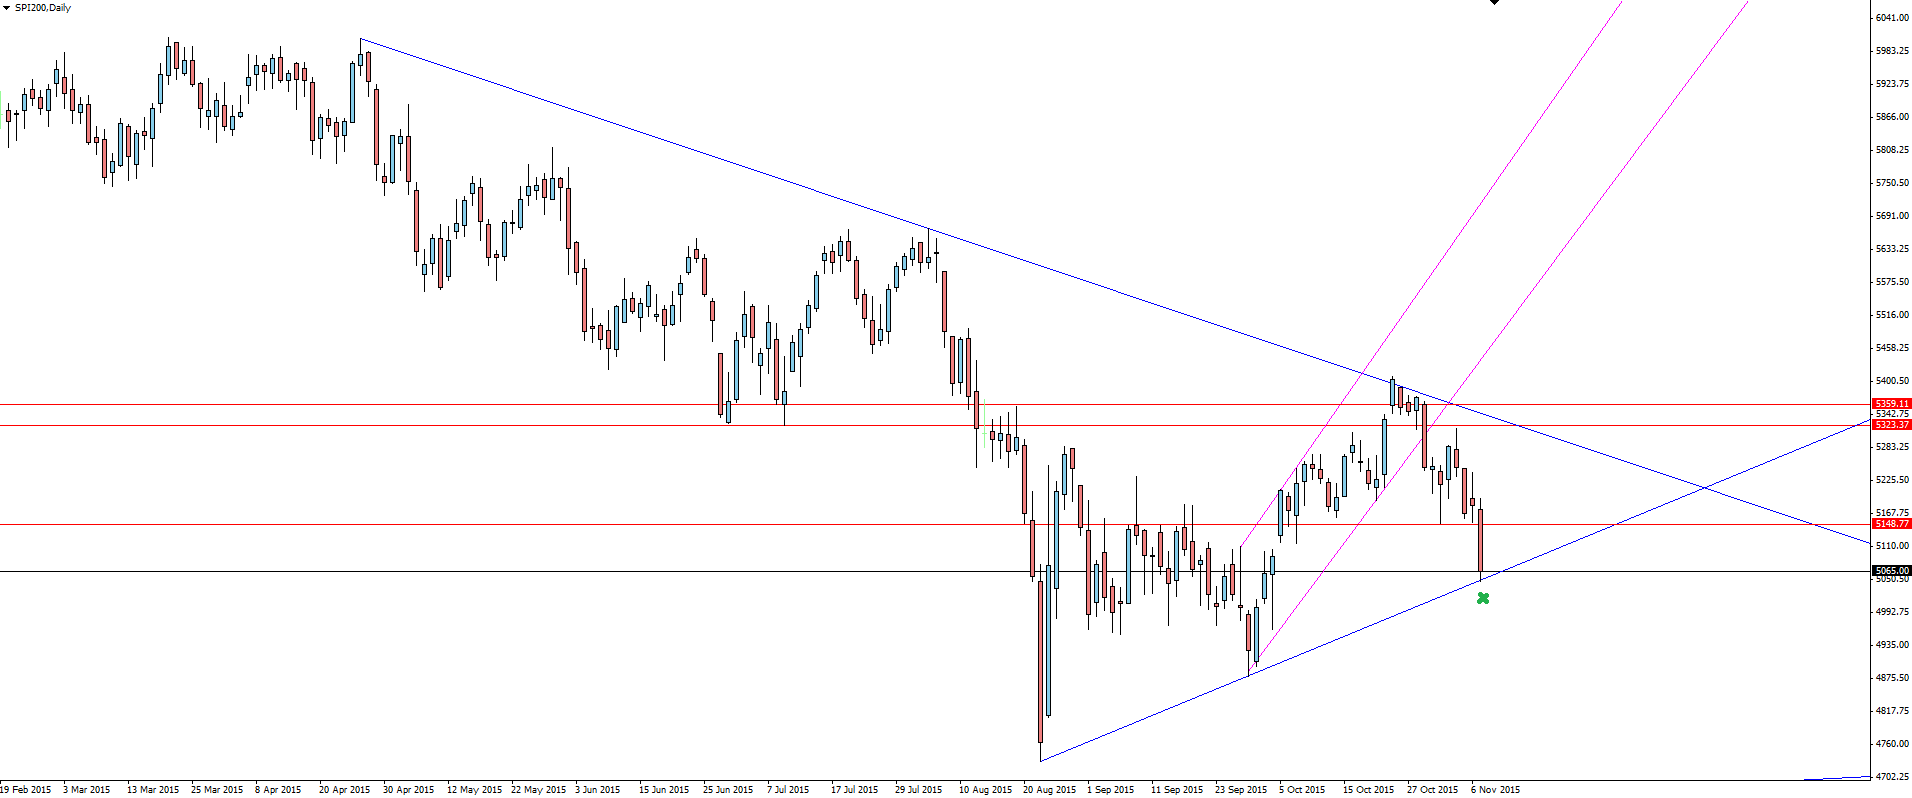
SPI200 Daily:
Click on chart to see a larger view.
The daily chart showed that price had completed flagging back into the major bearish trend line where it had been rejected.
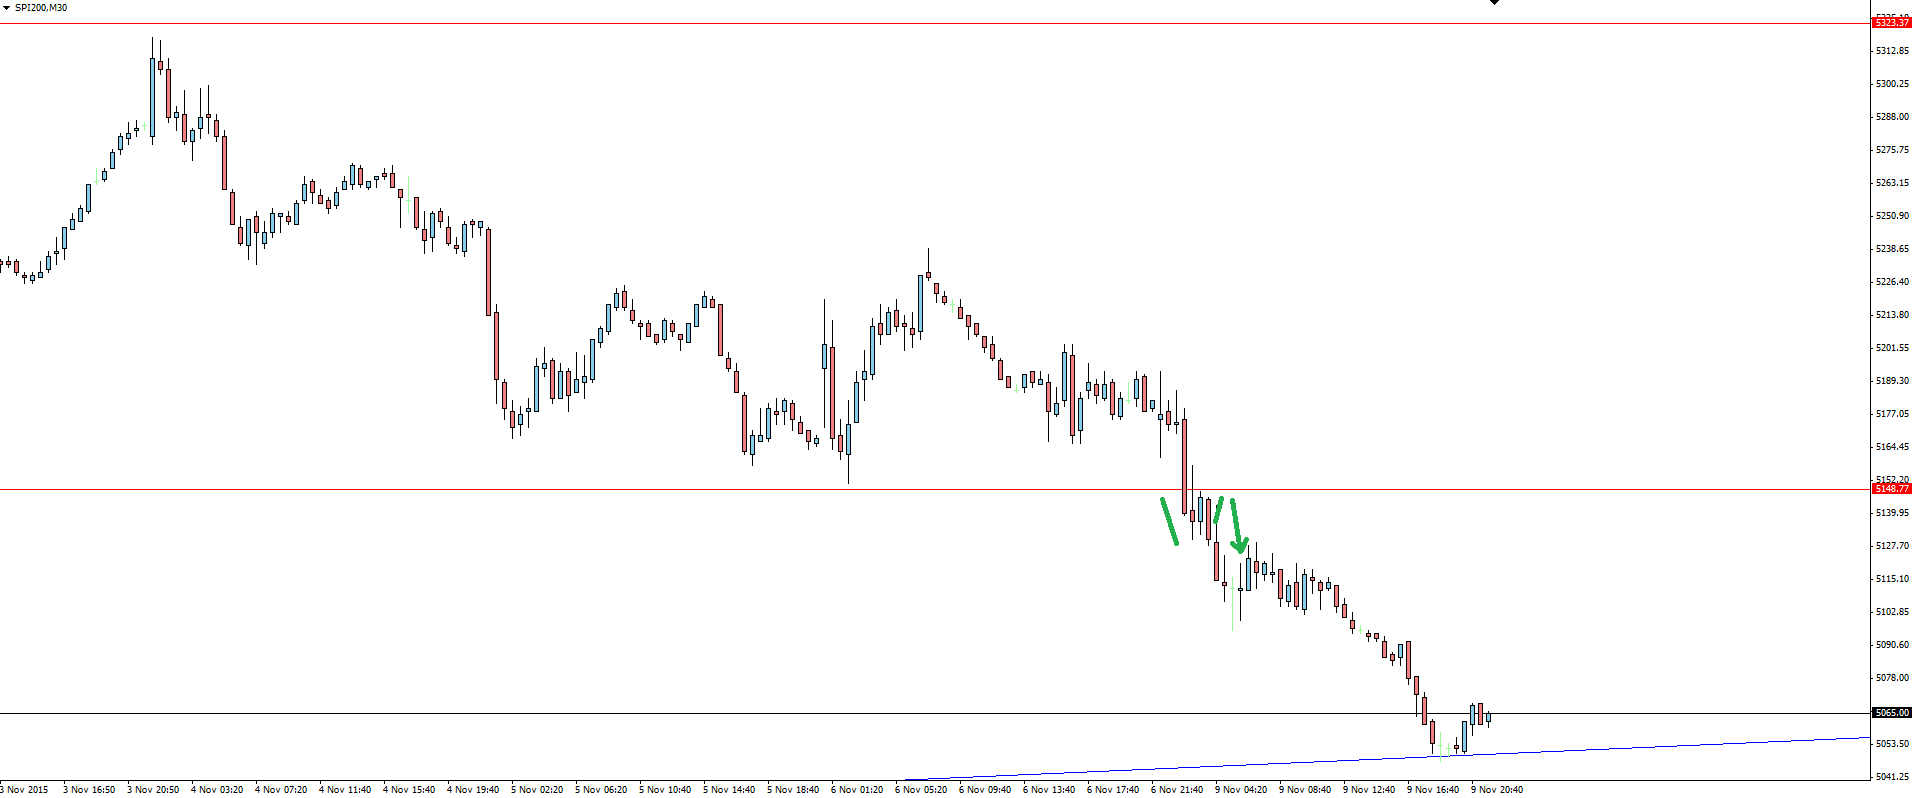
SPI200 30 Minute:
Click on chart to see a larger view.
The setup came after the open on the 30 minute chart as price plummeted through previous swing lows acting as a strong support/resistance level that we could manage our risk around. Price broke through support and came back to re-test the support level, this time as possible resistance.
If you took the trade, then well done. As you can see, the scenario played out with minimal drawdown, with the level holding and the trend continuing down to the next level of major resistance that we had marked on our daily chart.
The trading lesson to take from this setup is that that even if you miss an initial breakout, quite often you can take a short term re-test as confirmation to get on board the trade.
Risk Disclosure: In addition to the website disclaimer below, the material on this page prepared by Australian regulated Forex broker Vantage FX Pty Ltd does not contain a record of our prices, or an offer of, or solicitation for, a transaction in any financial instrument. The research contained in this report should not be construed as a solicitation to trade. All opinions, Forex News Centre research, analysis, prices or other information is provided as general market commentary and marketing communication – not as investment advice. Consequently any person opening a trading account and acting on it does so entirely at their own risk. The experts writers express their personal opinions and will not assume any responsibility whatsoever for the actions of the reader. We always aim for maximum accuracy and timeliness and No Dealing Desk Forex Vantage FX shall not be liable for any loss or damage, consequential or otherwise, which may arise from the use or reliance on this service and its content, inaccurate information or typos. No representation is being made that any results discussed within the report will be achieved, and past performance is not indicative of future performance.
