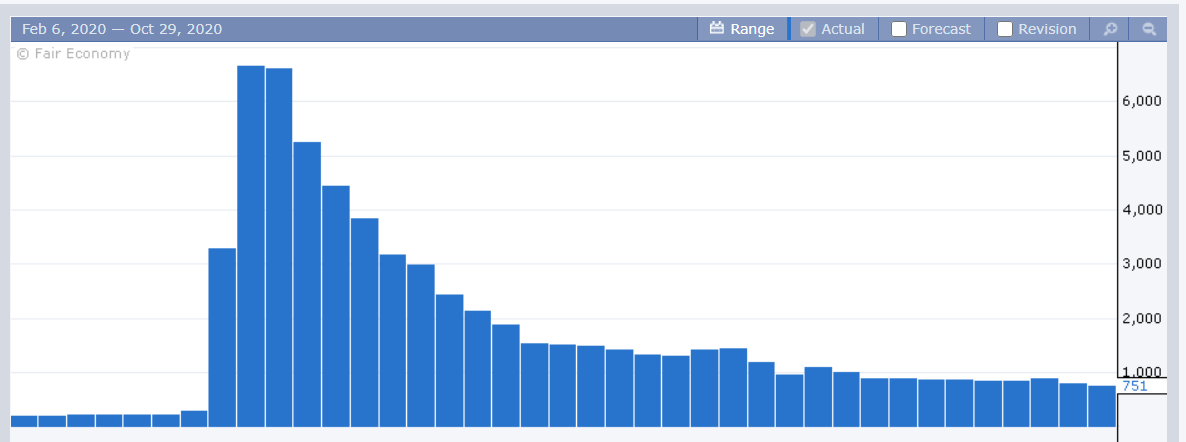
Weekly unemployment claims came in at 751,000. A slight down tick from the prior week.
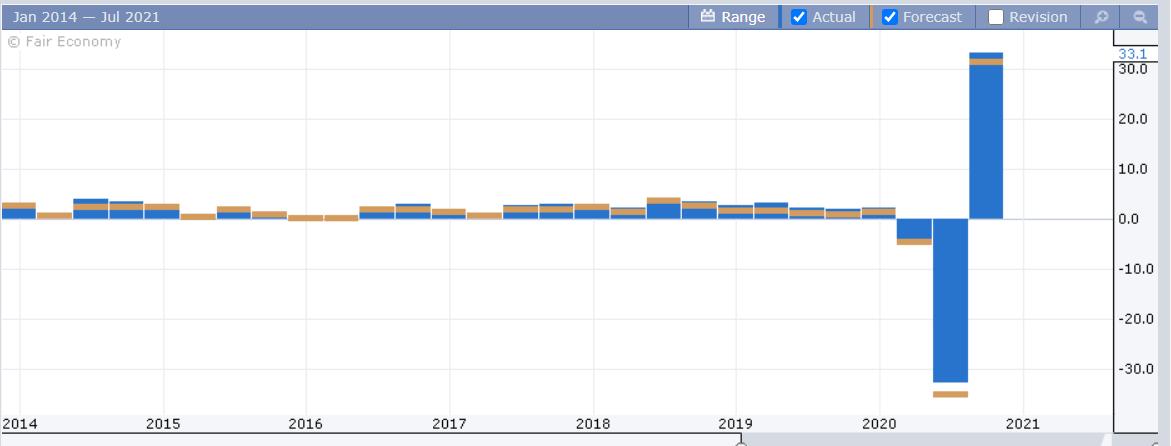
Our first look at Q3 GDP confirmed our positive sentiment, with preliminary numbers coming in at +33.1%. In contrast to prior recessions, there was nothing wrong with the economy. It was a result of shutting the economy down. And therefore it shouldn’t be a surprise that the removal of restrictions – not to mention record stimulus – leads to a solid rebound.
But lockdowns are a terrible and costly idea. You can’t just turn the economy off and on like a light switch. It is estimated we lose about 7% of the economy that never returns for each month of lockdowns.
The reports of lockdowns in Europe is a concern. All bets are off if they are implemented here. I sincerely hope is doesn’t come to that. I don’t believe it should. The growing loss of freedom and privacy after every crisis is concerning to me. But I digress.
As a result, Q4 forecasts are subject to major revisions. From the data we’ve seen so far, a reversion to a modest pace of growth looks likely. But we have a long way to go.
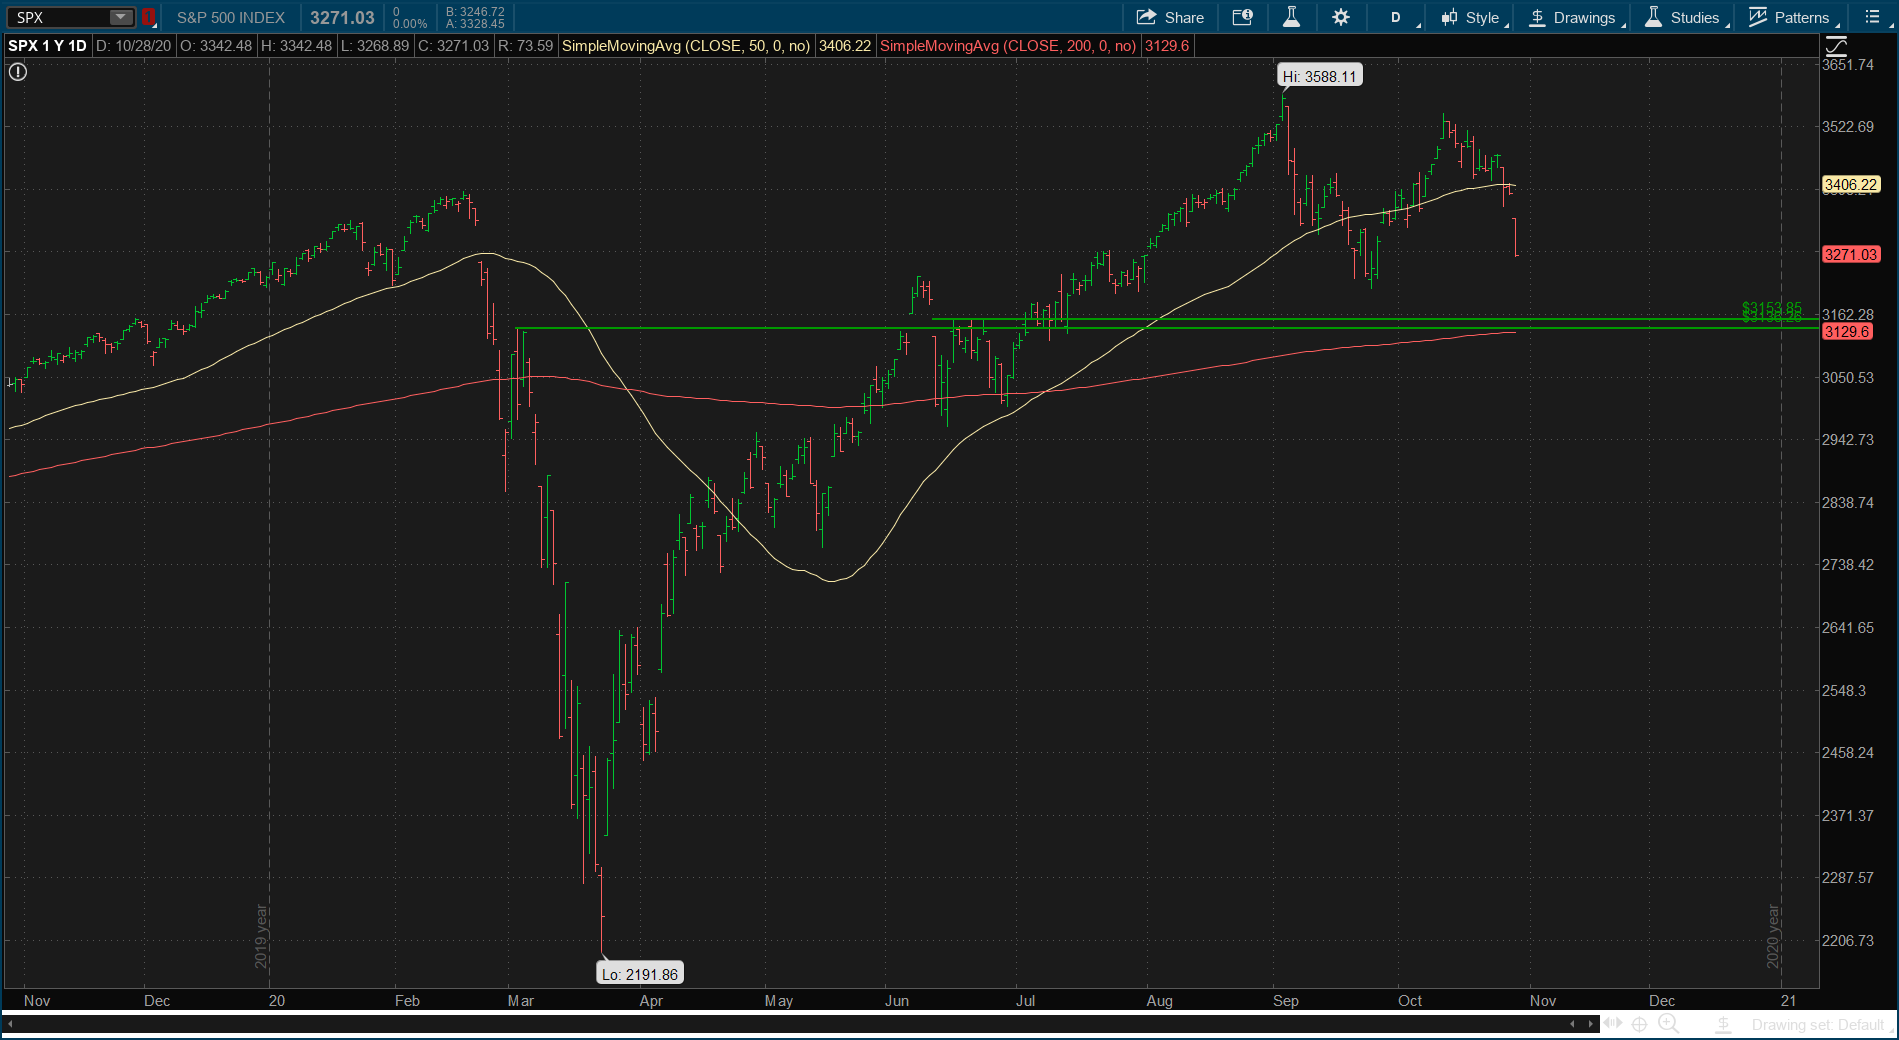
To the markets: Wednesday was a tough day. 900 points sounds like a lot but its really about 3%, which is an average bad day on Wall Street. Regular readers know these pullbacks to the 200 day following a breakout are pretty common. If that’s where we are, I see support in the area of 3150 on the S&P 500 as a logical target. There is a lot of confluence there. Again, all bets are off if lockdowns are reinstituted. So whether or not that area would be support (if it even gets there) is unfortunately out of anyone’s control. I can’t wait for the day we can focus on fundamentals again!
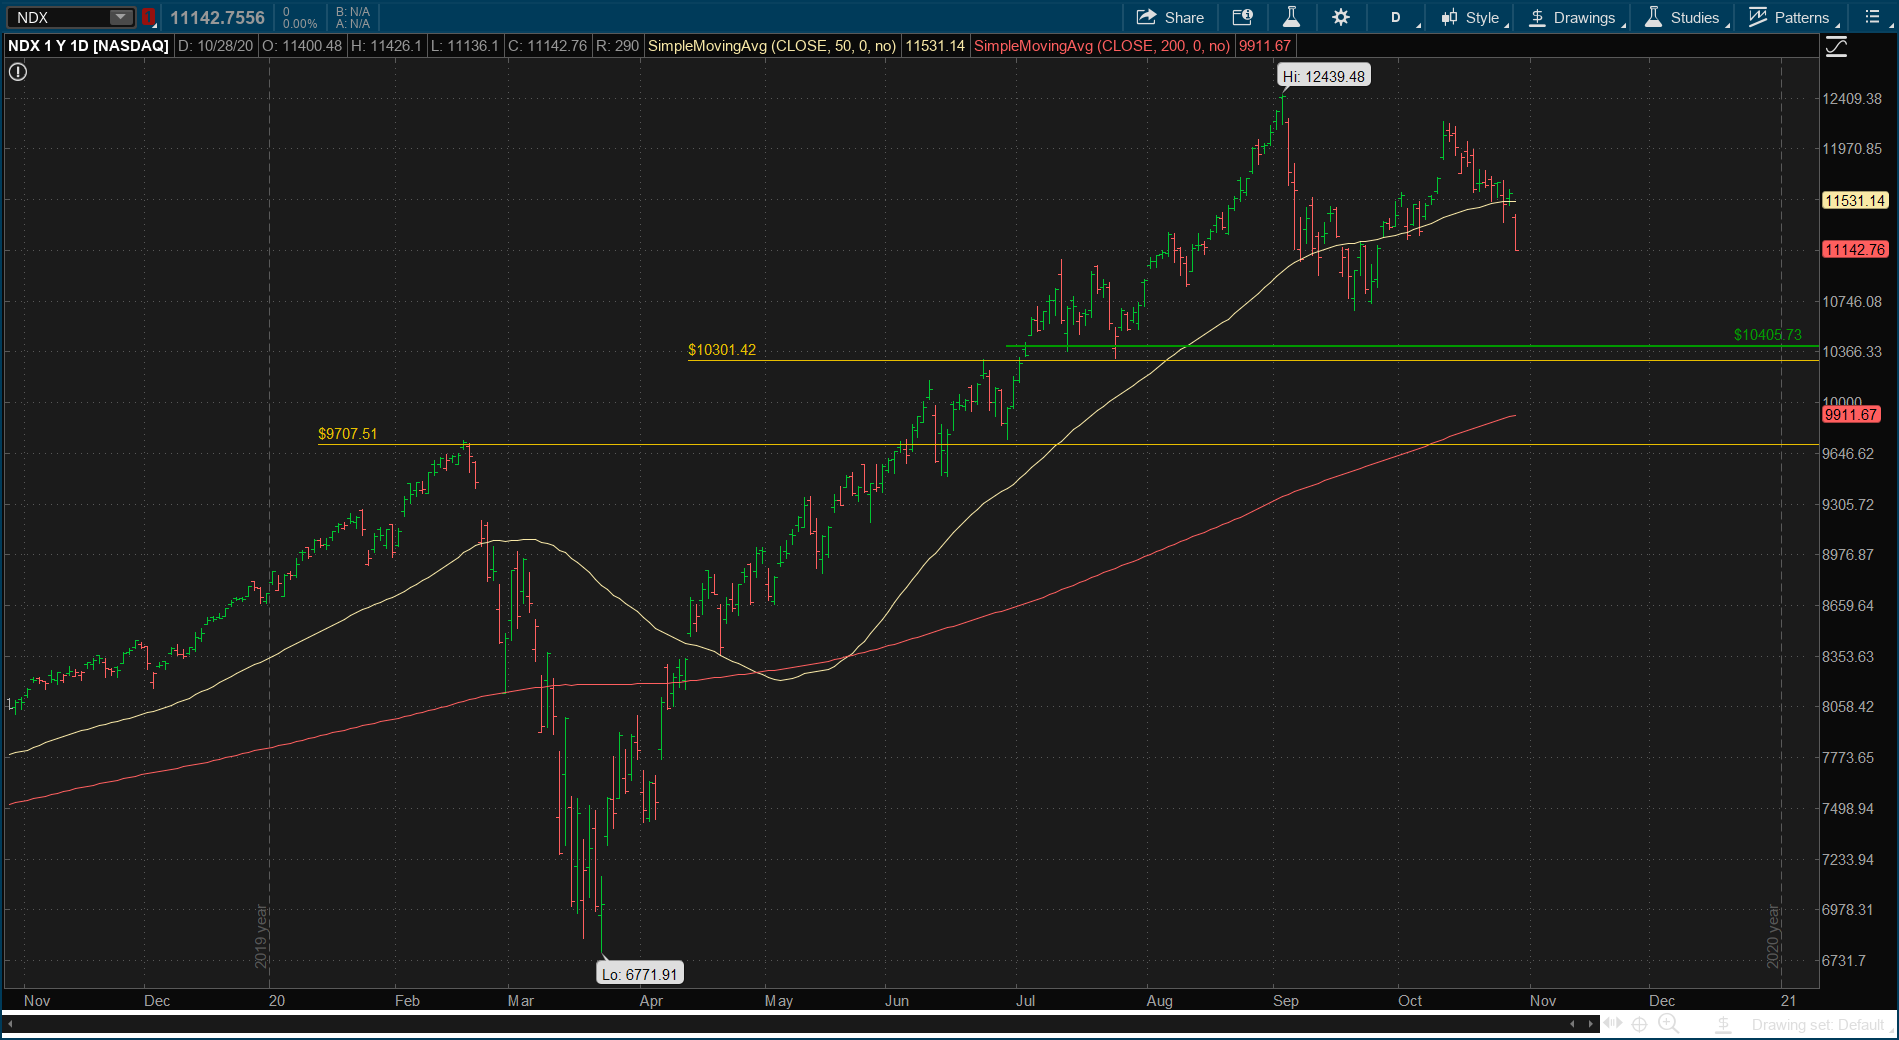
On the NASDAQ 100, I see a similar setup in the 10,400 level if more weakness occurs.
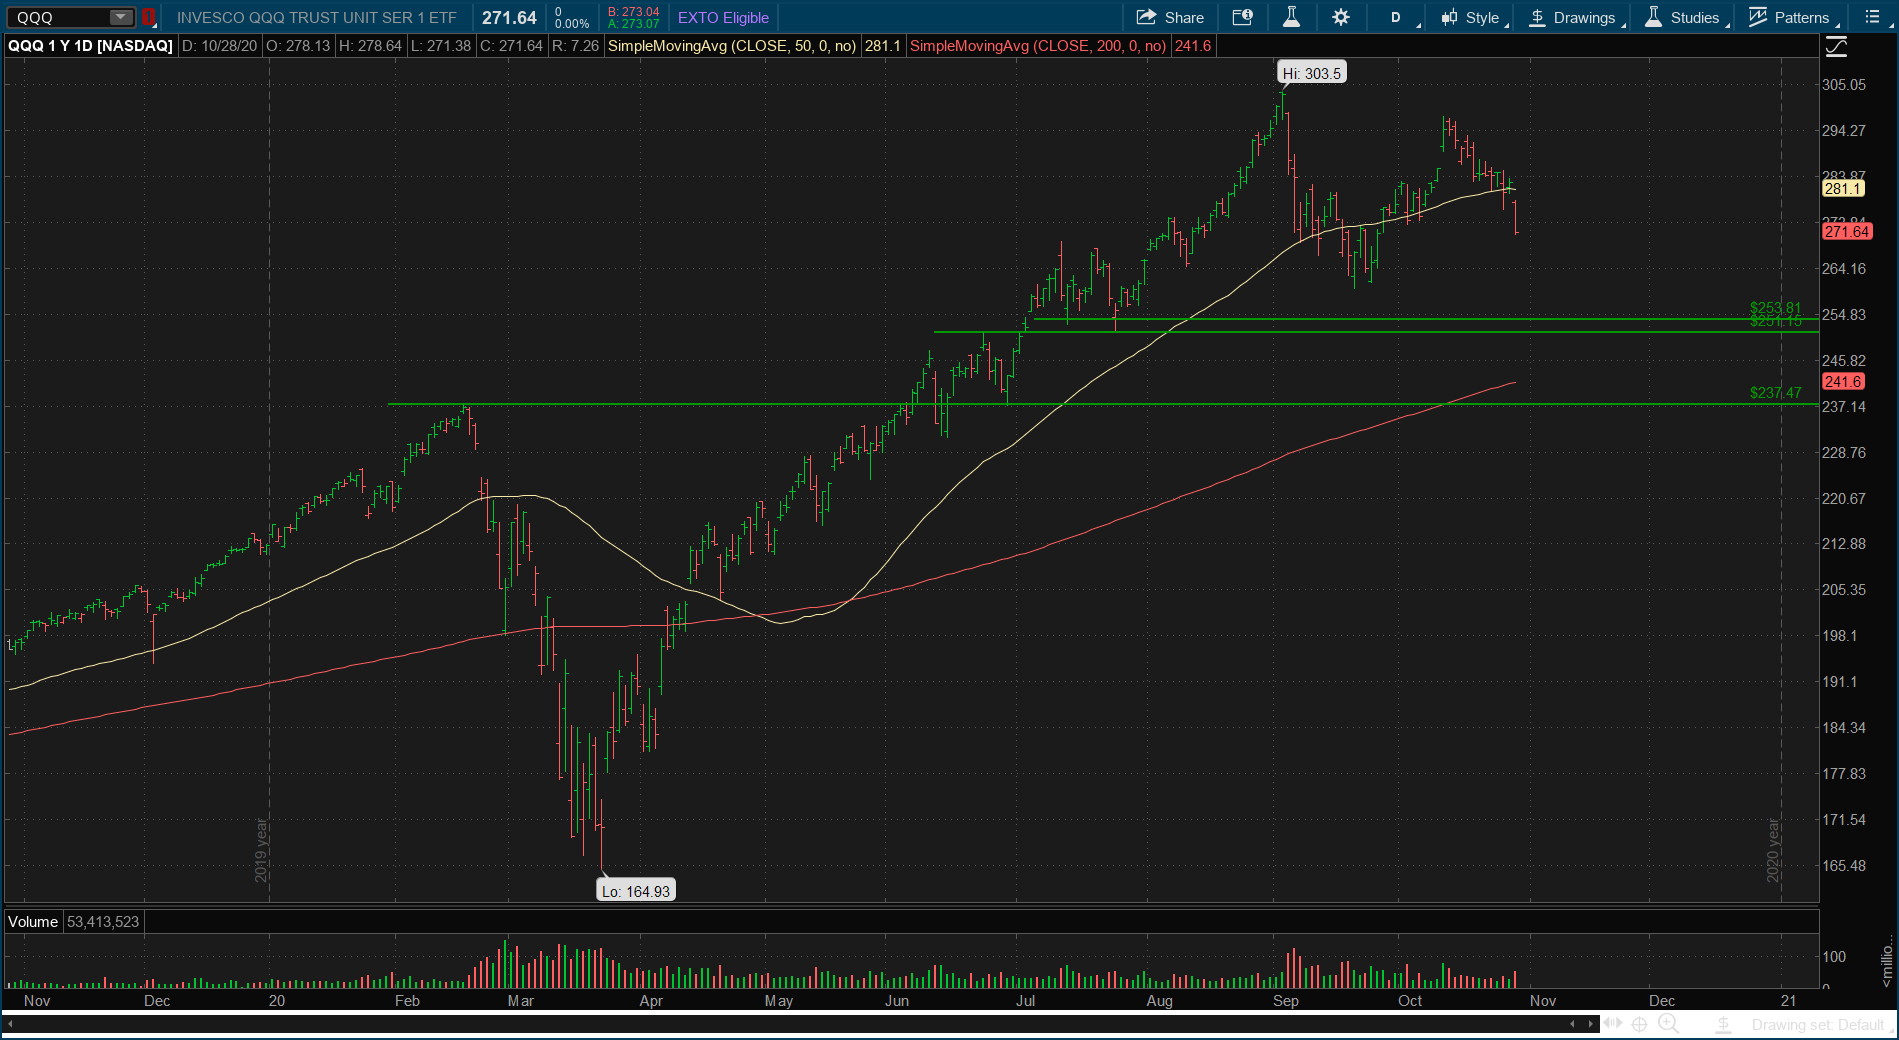
That’s in the range of $251-254 on the QQQ's (NASDAQ:QQQ).
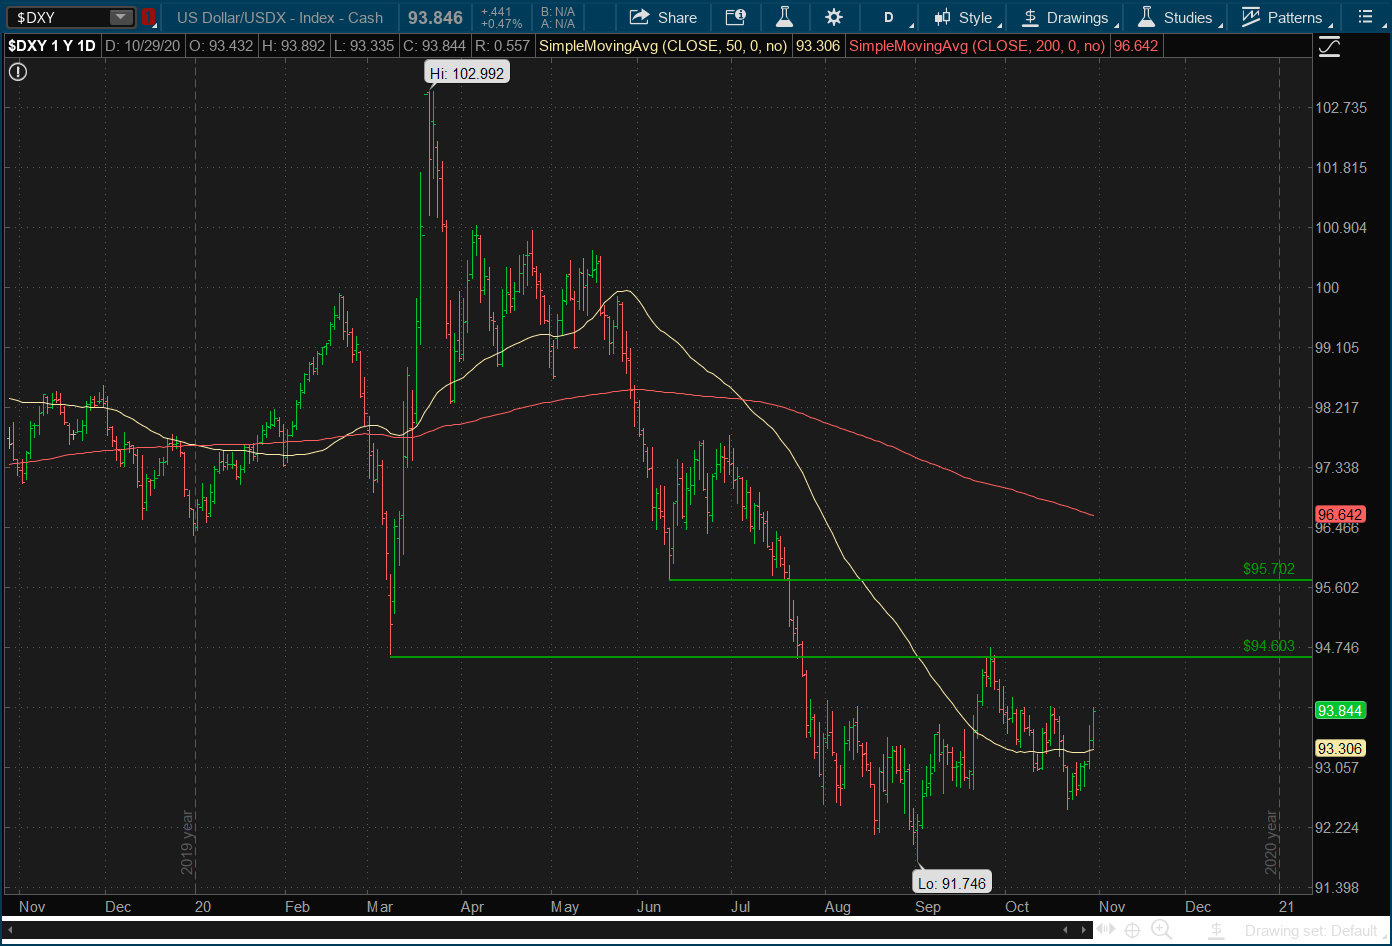
Taking a quick look at the US Dollar, if you recall my post on Gold and the US Dollar a few weeks back, I pointed out the $94.60 level as resistance. That worked out quite well. The dollar is firming up again with these macro issues. Given the level of fear in the markets (VIX above 40), I would suspect the USD may break above $94.60 this time around. The next upside resistance point I see is $95.70. This would put some downside pressure on commodities.
A declining dollar benefits multi-nationals that have to convert their overseas earnings back to USD. The same works true in reverse. The demise of the USD is greatly exaggerated. Depending on the source, the USD is used in 65-75% of global trade transactions. With very little change over the last 5 years. And every time there is a crisis, the flood of demand for safe dollar denominated assets is overwhelming.
The Fed’s QE programs were implemented to meet the strong demand for USD. That’s why the hyper inflation predictions never materialized. Inflation is caused when the market is over supplied and demand goes down. When you increase the money supply in response to the increased demand, no real inflation threat becomes of it.
This is not an endorsement of Fed policy. Regular readers know my long term concerns for keeping rates artificially low. If confidence returns so that demand for USD declines, the Fed will need to respond or risk inflation. That’s the real problem. They are not out of the woods. And we know the USD won’t be the top dog forever. But for all the troubles, they still look good in comparison to the rest of the world. It’s like stock valuations. You can’t just look at a 22x PE and say its high. You also need to compare it against the alternatives (fixed income).
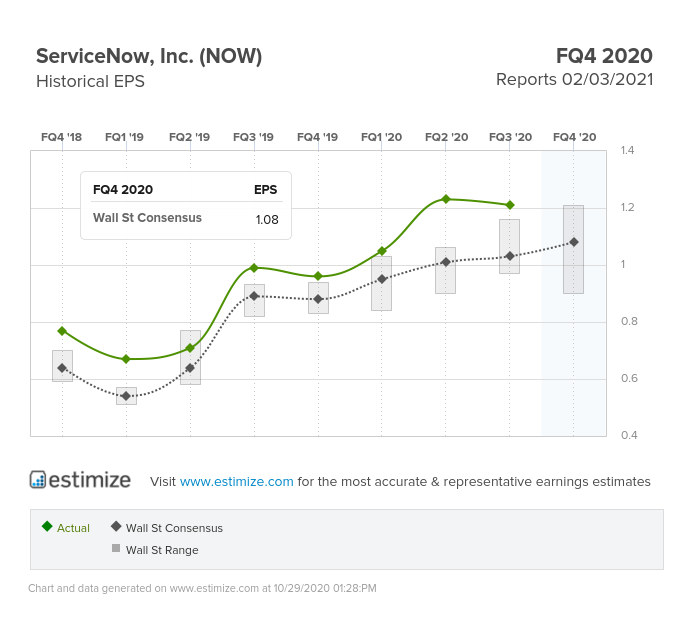
Quick update on earnings, one of my favorite non big cap tech stocks is ServiceNow (NYSE:NOW). The company beat on earnings and revenue expectations, reporting 22% increase in earnings and 30% increase in revenues. They raised full year guidance, anticipating revenue growth of 28-29% in Q4.
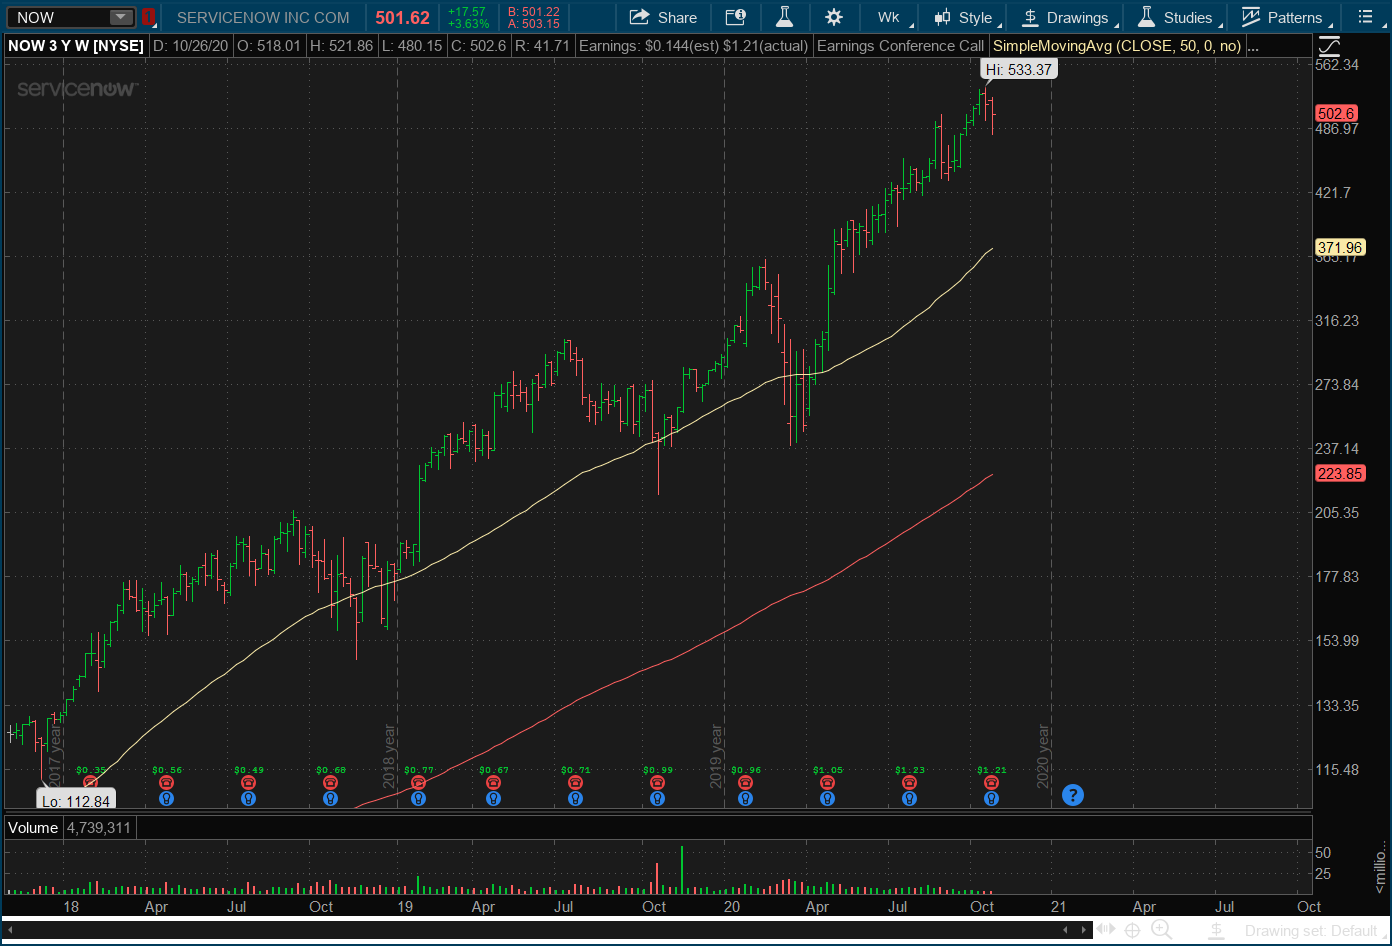
A lot to like here but much is already reflected in the stock price. The stock has just been moving higher and higher. This is one of the stocks on top of my shopping list in case we get a major decline in the stock market. I’d add to my position on a pullback to the vicinity of the 200 day.
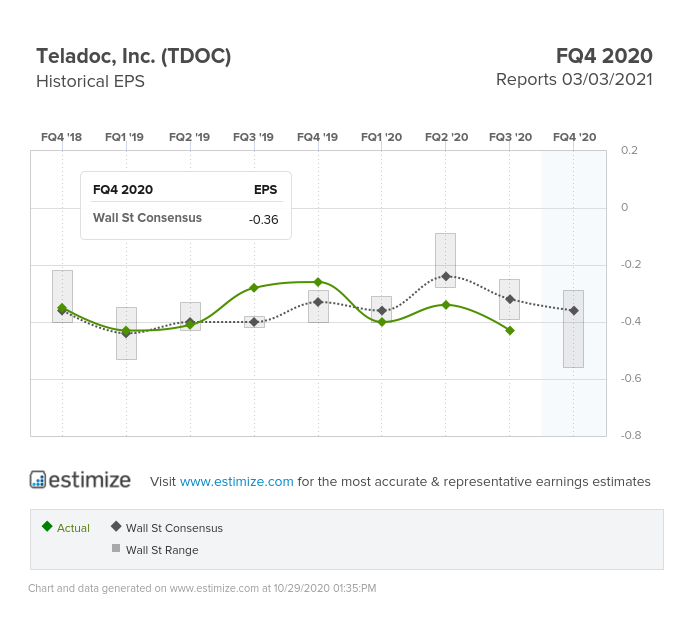
Teladoc (NYSE:TDOC) is another favorite of my mine. The company missed expectations on earnings (54% decline) but easily beat on revenues with a 109% increase year over year. The company reported paid memberships rose 47% to 51.5 million and total visits came in at 2.84 million.
This one falls into the speculative growth category and I’ve adjusted my positions to account for the additional risk. It makes sense on a variety of different levels. The companies merger with Livongo health is a big step in the right direction. The stock has already had a massive run (up 171% this year alone), so a lot of good news may already be priced in. But excited to see what the future holds for this company and would likely add to the position on any major declines as long as the fundamentals remain intact.
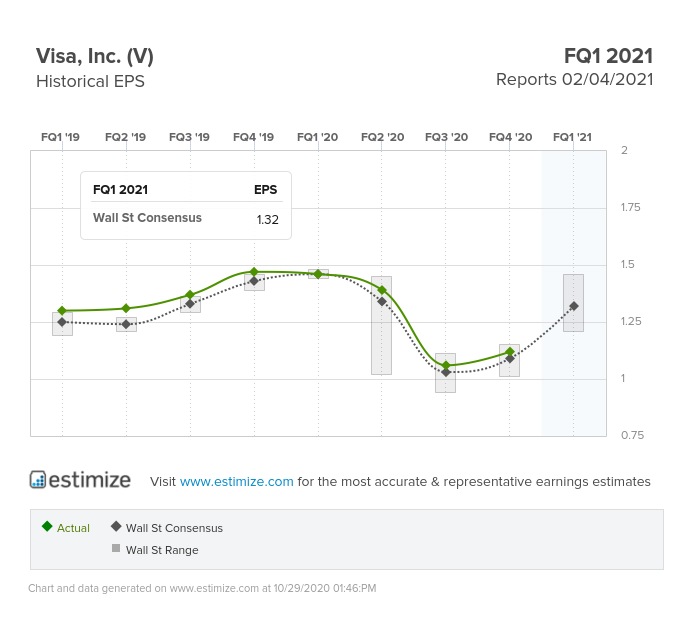
Unlike American Express (NYSE:AXP) and Mastercard (NYSE:MA), Visa (NYSE:V) actually beat earnings and revenue estimates but the results are still negative (-24% on earnings, -17% on revenue). V and MA are a great way to play the return to normal trade. But unfortunately we are probably still months (if not longer) away from that.
