Investor Focused Market Analysis
The S&P 500 index (US Stock Market) continues to be in and Uptrend.
The major trend line on the chart below must be broken in a big way before a full blown bear market will be confirmed. This is still months away at best so do not worry. The AlgoTrades INNER-Market Analysis will get us positioned when the time is right and enable us to profit as the stock market falls in value.
Your long term equity investments can continue to be held at this point. Speculative and momentum stocks (Russell 2000) continue to show weakness, so I would stay away from them. Large-cap stocks will likely be in favor as the safe haven “blue chip” stocks, but when the market is ready to roll over, all stocks will fall. The safe-haven plays should be bonds, gold and inverse ETF funds.
We do fear a US dollar currency crisis, and if so investors will be moving away from US investments and the massive bond bubble may burst. But at this time, it is not a concern.
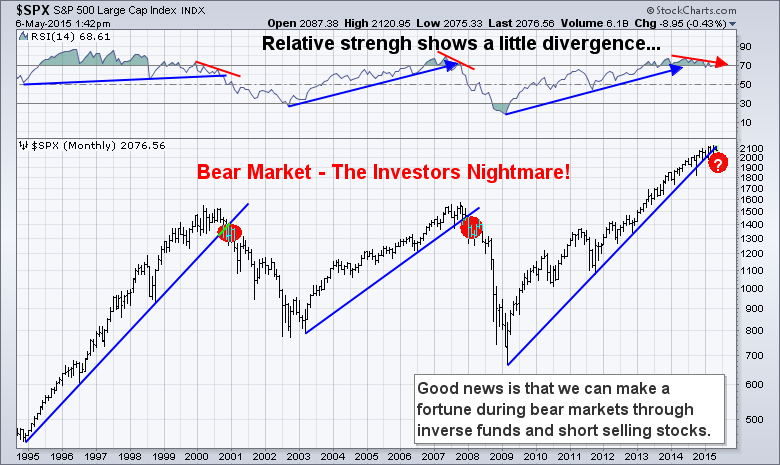
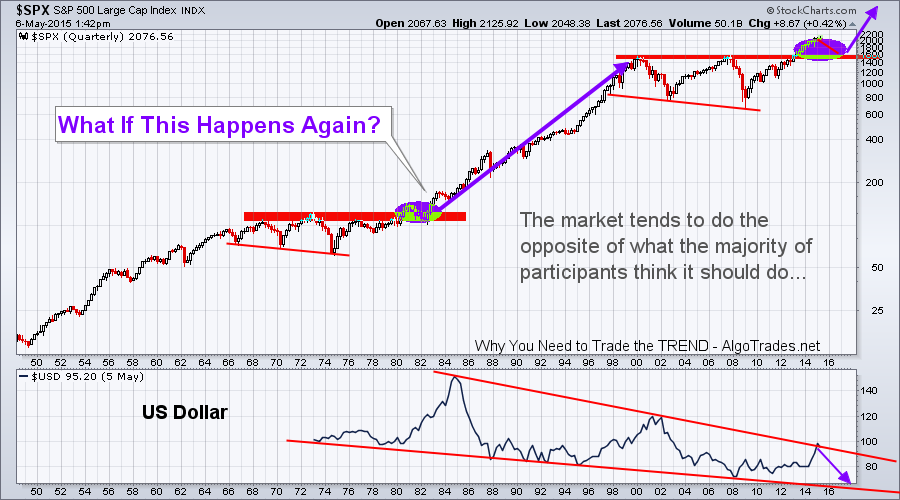
Chart – BIGGER PICTURE
This chart I feel provides a great perspective on the overall market trend and price patterns. This is the 70 year prospective. I hope something like this unfolds. Fingers crossed to a 12 month correction/bear market. This will build the new base for the next super cycle.
US Dollar has now reached the upper resistance trend line... we could see weakness in the dollar going forward...
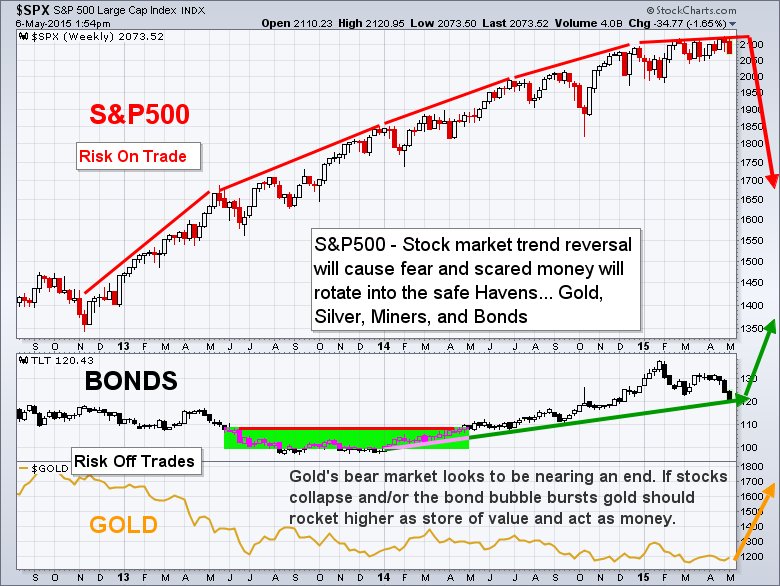
The Risk-Off Trade Is Slowly Unfolding
The S&P 500 index is losing its momentum. Money has been rotating into Bonds and global markets for a year in anticipation of the stock market correcting.
With six months of the S&P 500 index trading sideways we have had to focus on some other areas to find opportunities. Some recent winners have been long oil with (ARCA:UCO), long live cattle with (NYSE:COW), long Russia via (NYSE:RSX) and long Japan with (NYSE:EWJ). Those who follow my ETF trade alerts newsletter have avoided the recent chatter in the S&P 500. We have be doing even better with our active stock trades.
The Fear Index & Big Trend Analysis
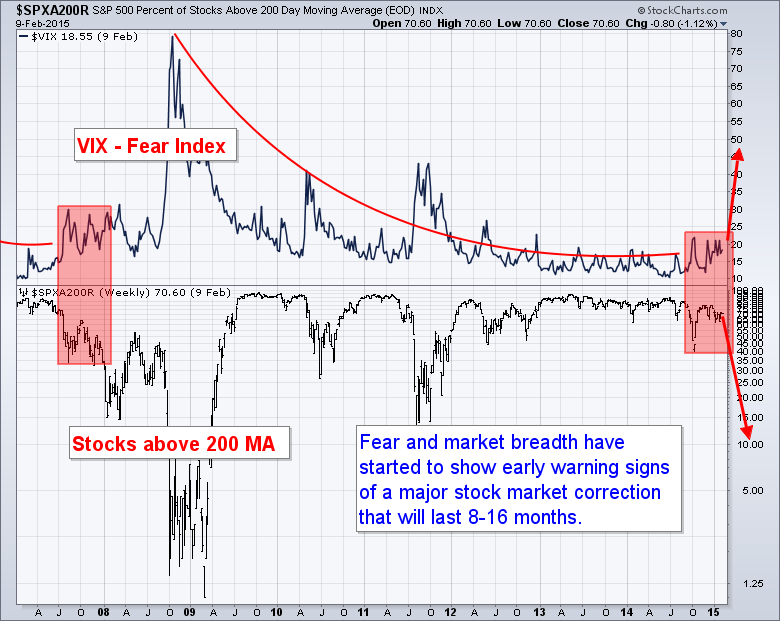
The VIX index has been trading at low levels for a few years. This suggests that fear is low, complacency is high, and that S&P 500 is becoming vulnerable to a stock market correction.
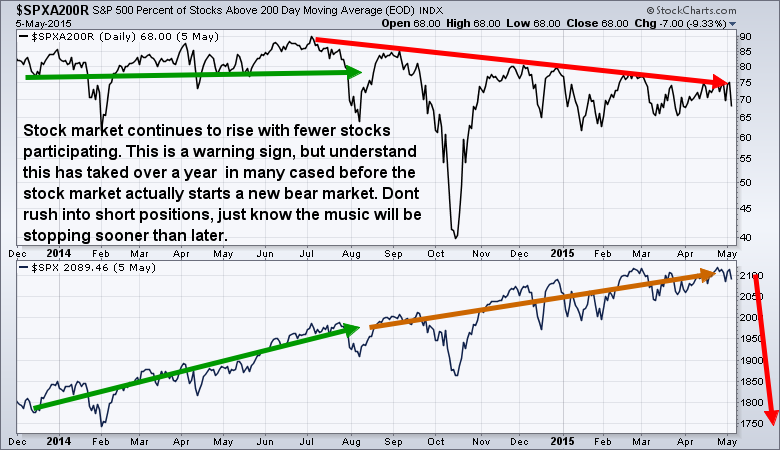
In the chart below, I have placed the VIX index above the stocks trading above the 200-day moving average. As the number of stocks trading above the 200-day moving average falls it’s telling us that fewer stocks are moving up in value while the broad market climbs. This is bearish.
This provides a great visual of how falling markets correlate with investor fears. While overall market breadth remains strong, a change in the VIX often provides an early warning sign of potential danger.
“When The VIX Is Low It's Time to Go, When The VIX Is High It's Time To Buy”
Stock Market Rises with Fewer Stocks – RED FLAG
Since mid 2014 the US stock market has become move volatile. Fewer stocks participating in the markets move up. This can be seen by comparing the percent of stocks trading above their 200-day moving average and the S&P 500 index.
When a stock market stalls, which is what it appears to be doing, the movement is comparable to that of how an aircraft stalls. It slowly continues to rise, things become choppy/unstable, then it drops and picks up speed trying to regain stability and control.
Once the stock market or an aircraft come to a complete stall they both end with a violent drop. While I am not calling a top yet, understand each month we are getting closer.
An analyst and trader I respect talked about how the Dow Jones is flat for the the year, yet investors think big profits are bing made. But in reality we have not seen real gains and the broad market expand in months. More investors are bullish now than we have almost ever seen according to Investors Intelligence Survey with a whopping 57% of investors bullish on stocks.
The CEO of Ameritrade (NYSE:AMTD) said that almost all of their 6 million traders/investor account are completely invested in stocks, and are leveraged using margin also. This is the ultimate contrarian warning sign of a bear market should begin over the next few months.
INNER-Investor Monthly Conclusion:
The great thing about being an investor is that the analysis and trends move relatively slow. We do not buy at the dead low, nor do we exit at the high, and sometimes we get shaken up during tough phases in the market like the second half of 2014 and first half of 2015.
I’ll be honest, the second half of 2014 and first portion of 2015 has been exceptionally tough to generate profits.
Winning streaks, and losing streaks are just part of investing and it happens to everyone and every strategy as the market has difference market phases and characteristics.
I believe the second half 2015 is will provide great opportunities and we will close the year out with decent gains.
