
In Part 1 of Turning Paper Into Gold I wrote about the flaws of some ETFs like GLD that are really a proxy to gold, but not actually ownership of gold. In other words, it’s paper gold. The real question that Part 1 asks is, do you trust the ETF to redeem your shares when the prospectus is so full of loopholes and the ETF custodian is a bank that is heavily invested in sub-investment grade derivatives? I left it to the reader to decide. But here in Part 2 and soon Part 3 I will offer further reasoning as to why physical gold and silver may be a preferred alternative to those who are trying to protect their wealth.
Gold Pricing Over the Years
People buy insurance for their home and car, but many don’t think about protecting their nest egg; their personal wealth. What is missing is the insurance that gold provides in protecting one’s wealth from banking shenanigans, Federal Reserve madness and future inflation. But also, gold represents real wealth like no other asset. Throughout the history of mankind, gold has represented wealth. Gold’s price was controlled since the creation of the Federal Reserve in 1913 up until Nixon took us off the Gold Standard in 1971. Since that time, and with the ability of American being allowed to buy more than $100 of gold in 1975, gold shot up in price rather quickly moving from the fixed government controlled price of $40.62 in 1971 to $160.86 by 1975 and an all-time high of $850 by 1980.
From 1980 to the year 2000 the price of gold languished with higher interest rates and double digit returns. The U.S. economy was producing things in those years and in 1986, when government didn’t have too much to fear about people buying gold, we saw the introduction of the American Eagle Gold coins with the passing of the Gold Bullion Coin Act of 1985.
Many of those who despise gold will point to the 1980 to 2000 years as proof that gold can return to a time when it didn’t really matter. But the evidence points otherwise. One could compare how much debt the U.S. had in 1980 versus how much debt we have today and be convinced that the U.S. dollar is in trouble as the debt load goes higher every year, but it was the introduction of the Euro that saw real competition to the dollar beginning in the year 2000. No longer was their a one world currency, the U.S. dollar, but now two. Gold started to move higher as the dollar sank after the Euro introduction as investors looked to hedge their U.S. dollar investments; U.S. stocks, U.S. bonds, U.S. Treasuries. But gold didn’t really start to shoot higher until the introduction of the various ETFs like GLD that one could invest in allowing for an easier path to gold ownership. The amount of gold held by GLD alone today amounts to what some of the largest Central Banks in the world own. All of a sudden, those who wanted protection from the possibility of inflation had an easy way to acquire gold and silver.
Exchange Traded Funds – A Further Explanation
Since there are now so many ways investors can play markets, one has to consider we are in an unprecedented arena where many different types of assets can be bought and sold in minutes with the introduction of ETFs. There are over 1000 ETFs today, representing 25% of the trading volume on the U.S. national exchanges and over $1 trillion of value. But one has to wonder about some of these ETFs like the exotic or leveraged ETFs that are coming into fruition.
In the case of silver, for example, there is an ETF with the symbol USLV that can get an investor 3 times their return of the price of silver (or lose 3 times the return should the price of silver fall). This in my opinion is akin to gambling. Why stop at 3x leverage? Why not 10x leverage? Pretty soon we’ll have the tradeable market and one’s investment portfolio look like a craps table. Put $1,00o on XSLV for me please (I just made that symbol up to represent 10 x the silver price).
In Part 1 of this article I pointed out how there are some issues to consider when investing in the gold and silver ETFs. I said that while ETFs can be good trading vehicles, they should not be considered as an alternative to protecting ones wealth with physical gold and silver. Besides the ETF taxes and fees that eat away at one’s holdings, the fact that banks are in control as custodians is what scares me the most. Holding physical gold in one’s own possession you have no fees and you don’t pay taxes on it until you sell it, not every year whether you want to or not with ETF redemption’s that trigger a tax. What was listed in Part 1 was one reason to turn paper ETFs into physical gold (and silver).
What Is Keeping The Gold Price Down?
What I want gold bugs to consider, and believe me I am one but for different reasons than most, is a few of the following observations as to what is really keeping the gold and silver price down.
- VIX – Volatility & S&P 500
- 2. TBT – 20 Year Treasury Short
- 3. U.S. Dollar Index, Euro and Yen
Looking at the VIX chart below, we have seen what a good job those who want you to believe that all is well with the markets have done in keeping this market propped up.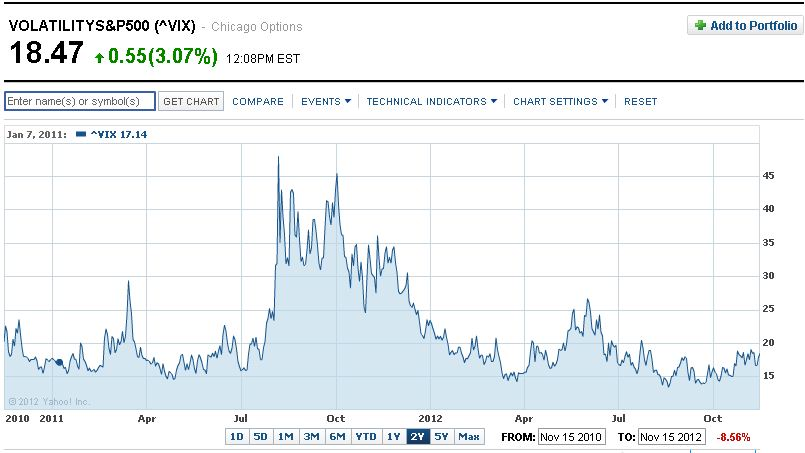
But speaking of the “exotic ETFs” I mentioned earlier, compare the above chart to the 2x leveraged TVIX below. Notice any discrepancies to the downside over the last 2 years (TVIX began trading Nov. 30, 2010 at 112.35)? I am sure that many investors in TVIX, a favorite of daytraders for awhile until it was halted for a month by Credit Suisse, aren’t too happy with their returns. A good explanation of this divergence between the VIX and TVIX can be found here.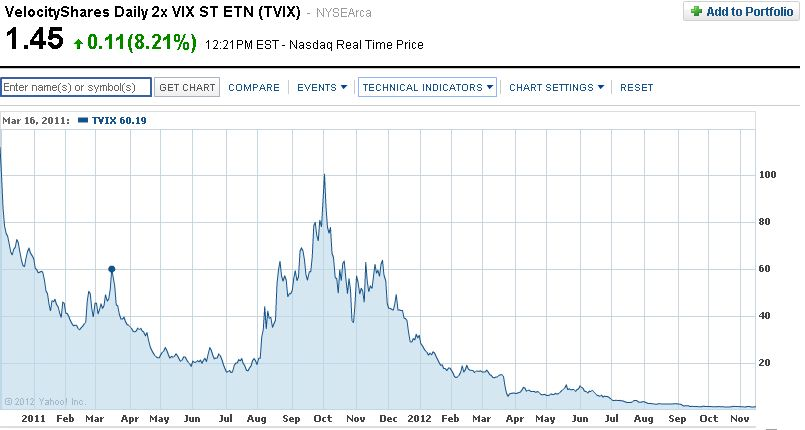
Part of the reason for golds struggle has been this complacency in the markets. With interest rates at such a paltry return, more money has flowed into the market chasing any return. In September, when the S&P was at 1435, I started warning investors of a stock market bubble based on the data I saw at the time. Today the S&P 500 has fallen 85 points since that warning as seen in the chart below.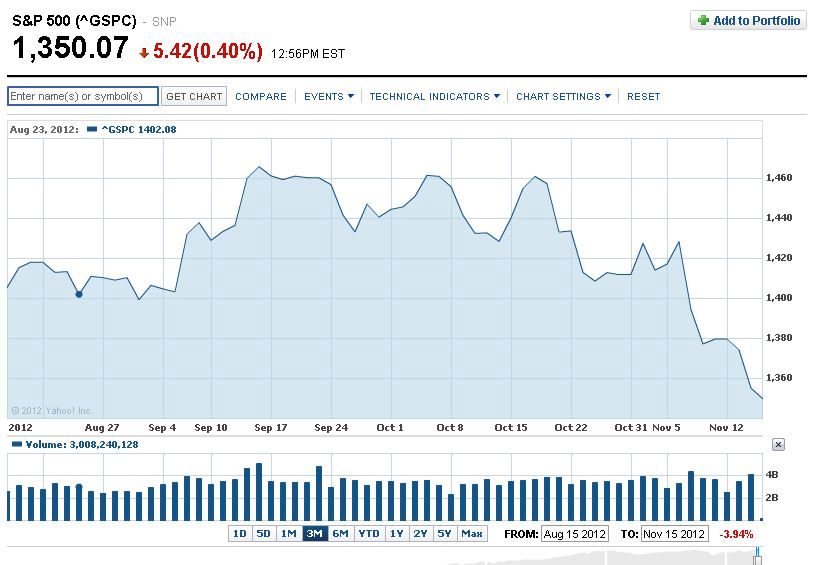
The VIX has been rising of late and smart money has all along been accumulating gold by dollar cost averaging into a position, waiting for the next move up. As I have said many times in my articles, it’s the tortoise vs. the hare when it comes to gold.
TBT – 20 Year Treasury Short
I follow TBT to get an idea of how relevant the Fed and their various programs really are, while gauging how confident the investor is in the U.S. economy and the Fed. TBT represents two times the inverse (-2x) of the daily performance of the Barclays U.S. 20+ Year Treasury Bond Index. Because it was getting so low (or perhaps they didn’t want traders to be able to buy more shares at lower prices?), ProShares did a 1:4 reverse split on October 5th and since that time have fallen $6.26 a share).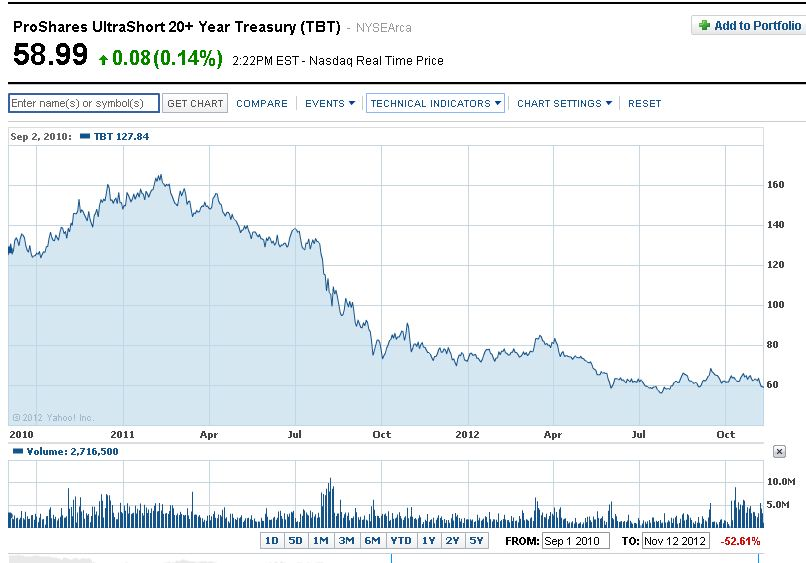
I don’t believe the confidence, as seen in the losses investors have taken in TBT over the past few years, is warranted, but one cannot fight the data before them. We are approaching a bottom in TBT as the Fed can’t play this game as well as Japan has over the years. The U.S. is not a net exporter like Japan, and Japan holds U.S. debt on their balance sheet while the U.S. owes everyone else. While we are both fighting deflation, with sprinkles of inflation (mostly government involved related industries like student loans and health care costs). Food costs had been driven higher from the drought, and grain prices are settling back down along with oil.
U.S. Dollar Index, Euro And Yen
While many of the gold bugs have been saying “weaker dollar” in their daily monologue, I have stuck with my stronger dollar outlook for the short term. This goes against what any gold dealer would say to their clients, but I just call it like I see it.
The fact is, the Euro and the Yen make up 70% of the U.S. Dollar Index and Europe and Japan are in deep trouble. I pointed out the problems in Europe (although I have been negative on the Euro all year) in a September article Did Bernanke Implement QE Infinity to Save the Euro? Just look at the chart in that article dealing with the high external Debt to GDP ratios for every single country in Europe, including France at 286% and Germany, the alleged savior of the Euro at 213%.
People are protesting in the streets against government imposed austerity, primarily in Spain where the unemployment is 25% and Portugal at 15.8%.
The EUR/USD chart below shows a possible double top that has formed with what I believe to be a continued fall against the dollar.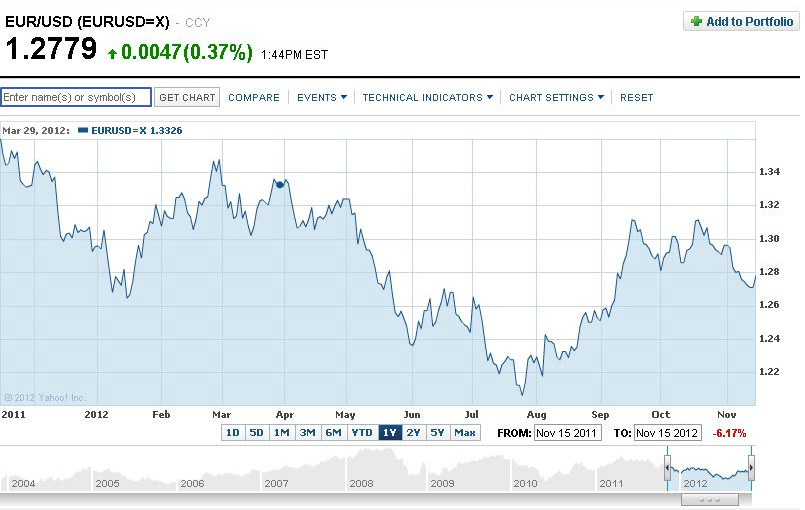 EUR/USD" width="805" height="510">
Meanwhile, over in Japan, another country with over 200% Debt to GDP, we saw today a big jump in the USD/JPY of 1.19%.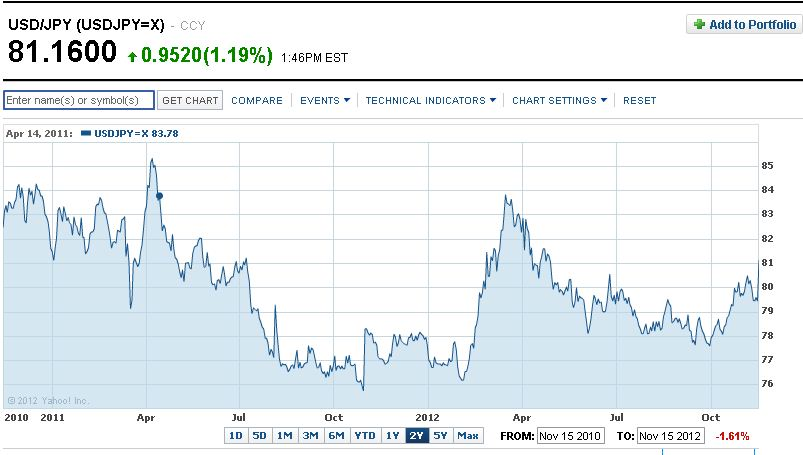 USD/JPY" width="803" height="455">
Meanwhile, Back In The U.S.A.
Everyone knows we have massive debt and future obligations here in the U.S. While the U.S. Debt to GDP ratio is hovering around 100%, we are still in better shape than Europe and Japan which is why I am dollar bullish. This could still have some ramifications for investors in gold moving forward as the Dollar and Gold have historically traded opposite of each other.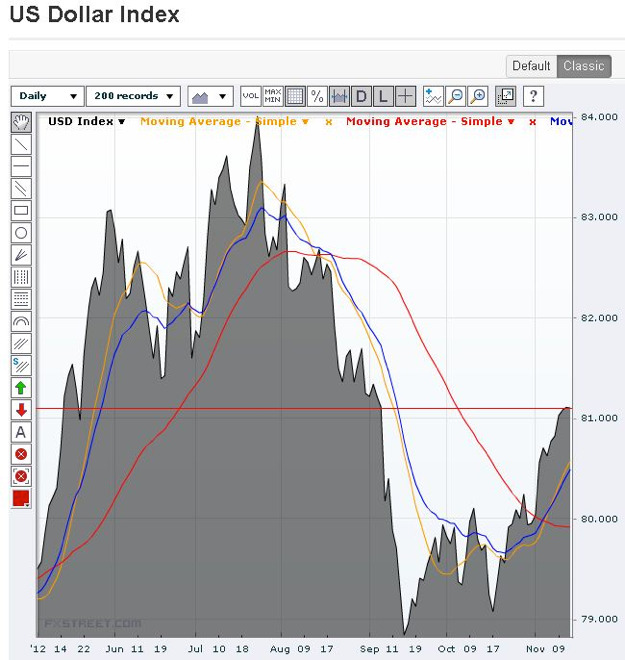
It’s a simple understanding of what makes up the Dollar Index that allows me to say that a stronger dollar may still be in our future.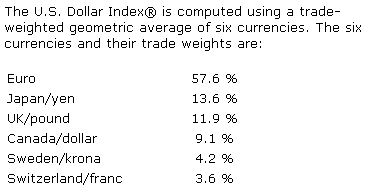
71.2% of that U.S. Dollar Index (Euro and Japan/yen) represents areas that are hurting from an economic perspective. Perception is what investors look at when deciding where to put their money. The above data tells us that fear has been complacent and is entering the market and treasuries have remained strong and the U.S. dollar isn’t crashing.
The Dollar, U.S. Treasuries and Gold/Silver are where investors will be headed. I will explain how this will all unfold in Part 3 in the coming days.