
Monitoring purposes SPX: Flat. Monitoring purposes GOLD: Gold ETF GLD long at 173.59 on 9/21/11 Long-Term Trend monitor purposes: Flat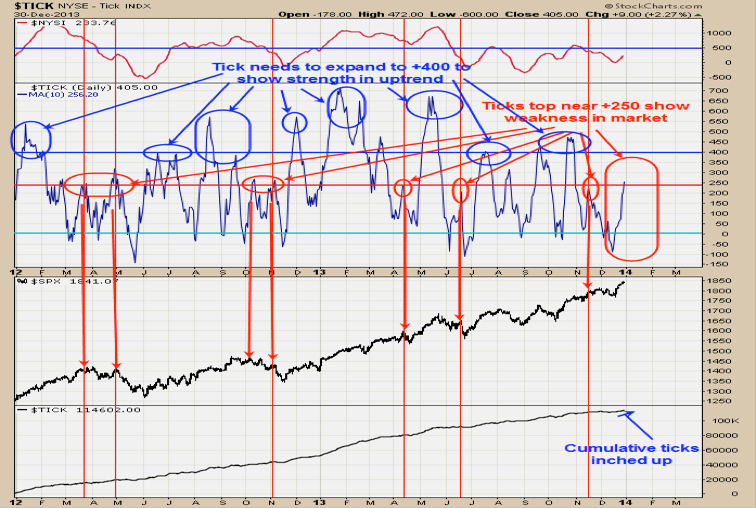
The rally has been going for nearly two weeks and today the 10-period moving average of the ticks did reach +250 range which is still considered a weak market. Bullish Seasonality runs out Thursday which is two trading days from now and if ticks remain in the +250 range would suggest market could start to pull back. However, if the ticks push higher into the +400 range would be a short-term bullish sign. The bottom window is the Cumulative ticks. In general when the Cumulative ticks are rising than that is a bullish condition and when trading sideways or down is a bearish condition. The cumulative ticks did modestly turn up today and a short term bullish sign. The top window is the NYSE McClellan Summation index. Strong signs for the market occur when the Summation index trades above +500 and stays there. A weaker market is predicted when the Summation index fails to get above +500 and consistently stays below the +500 level. The Current Summation index is +233.76 and still rising. If the McClellan Summation index turns down before reaching +500 will be a bearish sign for the market. For the McClellan Summation index to turn down the McClellan Oscillator must fall below “0”. Currently the McClellan Oscillator is at +108 and falling. If Ticks and Summation index show strength than will look for pull backs in SPX to get long.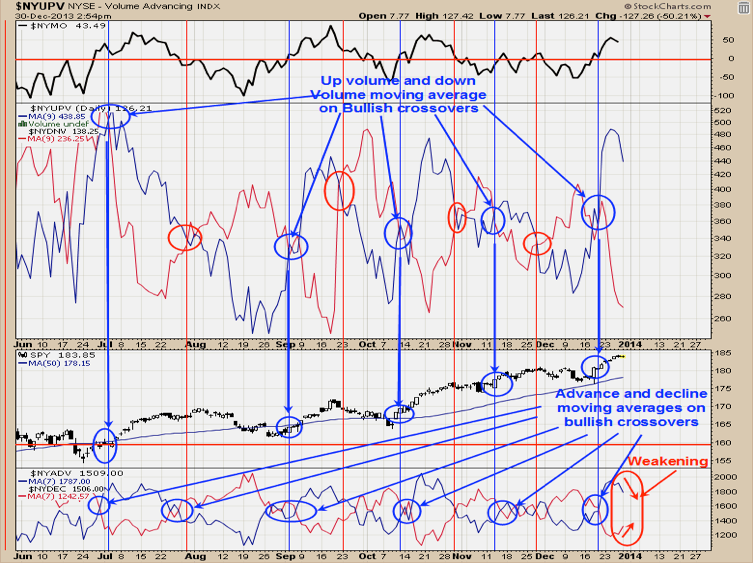
The bottom window is the NYSE advancing issues with a 7 period moving average and the NYSE declining issues with a 7 period moving average. Bullish and bearish signals are triggered when these two moving average cross and right not this indicator has a bullish crossover. Third window up is the NYSE up volume with a 9 period moving average and NYSE down volume with a 9 period moving average. Bullish and bearish crossovers also appear on this indicator and right now its on a bullish crossover. Therefore for the very short term the trend is up. Notice that both the Advance and decline moving average (bottom window) are moving towards each other and shows the uptrend is weakening and if these line do merge will lead to a bearish crossover and a possible bearish signal. This condition would also apply to Up volume and Down Volume moving average in window three up from the bottom. We will remain flat for now.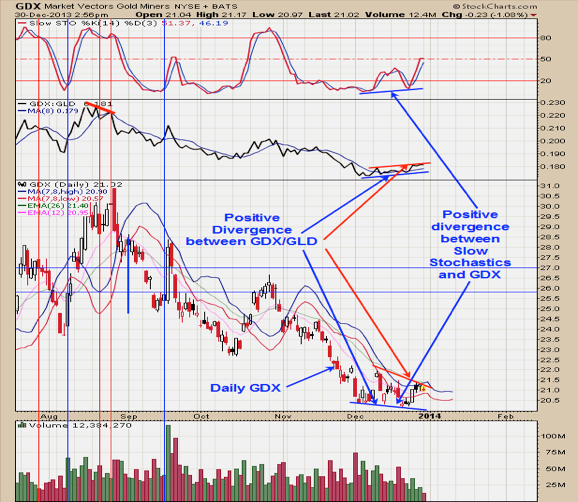
The monthly momentum charts for GDX have not turned up yet but the short term picture is showing positive signs. The top window is the Slow Stochastics where it made a higher low as GDX made a lower low which is a bullish divergence. Next window down is the GDX/GLD ratio. This ratio made a higher low as GDX made a lower low and also GDX/GLD ratio made a higher high as GDX made a lower high and both condition are bullish divergences. We have two types of moving averages on GDX and right now GDX is below both moving averages and until GDX closes above both moving averages the trend is considered down. However the positive divergences mentioned above may produce a bounce above the moving averages and a possible bullish trade could setup. Long NG at 5.14 on 10/8/12. Long GDX 58.65 on 12/6/11. Long GDXJ average 29.75 on 4/27/12. Long GLD at 173.59 on 9/21/11. Long BRD at 1.67 on 8/3/11. Long YNGFF .44 on 7/6/11. Long EGI at 2.16, on 6/30/11. Long GLD at 147.14 on 6/29/11; stop 170 hit = gain 15.5% . Long KBX at 1.13 on 11/9/10. Long LODE at 2.85 on 1/21/11. Long UEXCF at 2.07 on 1/5/11. We will hold as our core position in AUQ, CDE and KGC because in the longer term view these issues will head much higher. Holding CDE (average long at 27.7. Long cryxf at 1.82 on 2/5/08. KGC long at 6.07. Long AUQ average of 8.25.
- English (UK)
- English (India)
- English (Canada)
- English (Australia)
- English (South Africa)
- English (Philippines)
- English (Nigeria)
- Deutsch
- Español (España)
- Español (México)
- Français
- Italiano
- Nederlands
- Português (Portugal)
- Polski
- Português (Brasil)
- Русский
- Türkçe
- العربية
- Ελληνικά
- Svenska
- Suomi
- עברית
- 日本語
- 한국어
- 简体中文
- 繁體中文
- Bahasa Indonesia
- Bahasa Melayu
- ไทย
- Tiếng Việt
- हिंदी
Tuesday's Market Technicals
Published 12/31/2013, 11:17 AM
Updated 07/09/2023, 06:31 AM
Tuesday's Market Technicals
3rd party Ad. Not an offer or recommendation by Investing.com. See disclosure here or
remove ads
.
Latest comments
Install Our App
Risk Disclosure: Trading in financial instruments and/or cryptocurrencies involves high risks including the risk of losing some, or all, of your investment amount, and may not be suitable for all investors. Prices of cryptocurrencies are extremely volatile and may be affected by external factors such as financial, regulatory or political events. Trading on margin increases the financial risks.
Before deciding to trade in financial instrument or cryptocurrencies you should be fully informed of the risks and costs associated with trading the financial markets, carefully consider your investment objectives, level of experience, and risk appetite, and seek professional advice where needed.
Fusion Media would like to remind you that the data contained in this website is not necessarily real-time nor accurate. The data and prices on the website are not necessarily provided by any market or exchange, but may be provided by market makers, and so prices may not be accurate and may differ from the actual price at any given market, meaning prices are indicative and not appropriate for trading purposes. Fusion Media and any provider of the data contained in this website will not accept liability for any loss or damage as a result of your trading, or your reliance on the information contained within this website.
It is prohibited to use, store, reproduce, display, modify, transmit or distribute the data contained in this website without the explicit prior written permission of Fusion Media and/or the data provider. All intellectual property rights are reserved by the providers and/or the exchange providing the data contained in this website.
Fusion Media may be compensated by the advertisers that appear on the website, based on your interaction with the advertisements or advertisers.
© 2007-2024 - Fusion Media Limited. All Rights Reserved.