Scaling out of a winning stock trade can lead to greater profits, while minimizing risk. Here’s an insightful walk-through of how we bought and sold Tesla (NASDAQ:TSLA) stock for bigger gains with multiple exit points.
Back in May, well before Tesla’s parabolic moonshot, we posted that we were buying TSLA based on the formation of a bullish cup with handle pattern.
We finally closed the trade in our Wagner Daily model portfolio a few weeks ago, selling half the position for +25% gain and the remaining half for +87% price gain.
In this post, we walk through the charts of our exit points to show how you can use the same strategy for knowing when to take profits on other winning stock trades with similar patterns.
Continue reading to discover our rule-based stock picking criteria, followed by an insightful recap of the initial TSLA trade setup and profitable exit points.
Initial stock pick criteria
In a bull market, we focus on trading leading growth stocks that have the potential to generate solid gains of at least 20-40% over a 4-12 week period.
We also rely on a few moving averages to help find initial stock pick candidates.
Specifically, we look for trending stocks that are above their 50-day moving averages, and where the 50-day MA is above the 200-day MA.
This basic scan enables us to filter out stocks that are not already in an established uptrend.
Relative strength identifies leadership
After scanning for initial trade candidates, we next look for top growth stocks that are showing relative strength to the broad market.
In a strong market, we want to be in stocks performing better than the benchmark S&P 500 Index–especially when the S&P is just beginning to recover off its low.
Plotting a basic Relative Strength line (not to be confused with the RSI indicator) helps to identify potential leadership in a simple way.
Pure price momentum, such as a large percentage move off a recent low, is also a key factor in analysis of potential stock trade setups.
Being in a strong uptrend, Tesla ticked all the boxes from our initial scans.
We also liked that TSLA is an extremely liquid stock capable of large percentage moves. There are not many of these stocks in the market, so it’s a good idea to monitor such stocks for potential buy entry after finding them.
Technical analysis of TSLA buy entry
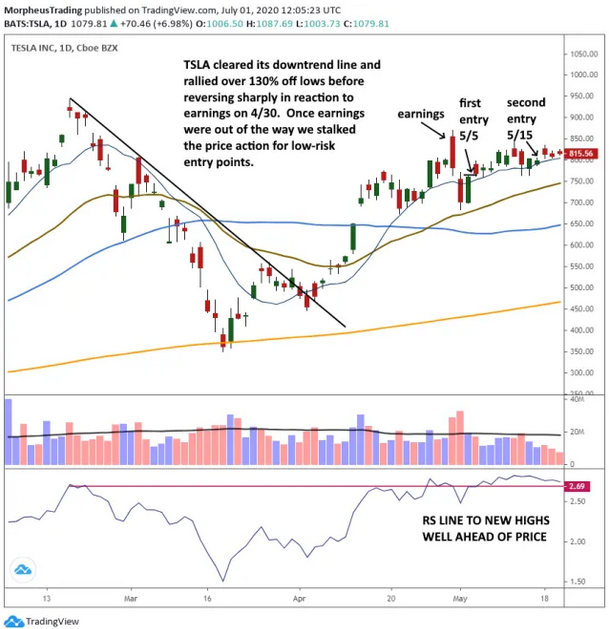
Below is a daily chart of TSLA that shows the exact entry points we listed for subscribers, followed by our detailed commentary on the initial trade setup:

With both buy entries shown above, we placed protective stops beneath the prior two-day lows.
Also, notice the Relative Strength line was setting new highs ahead of Tesla’s price–a reliable bullish signal.
How we managed the winning TSLA trade
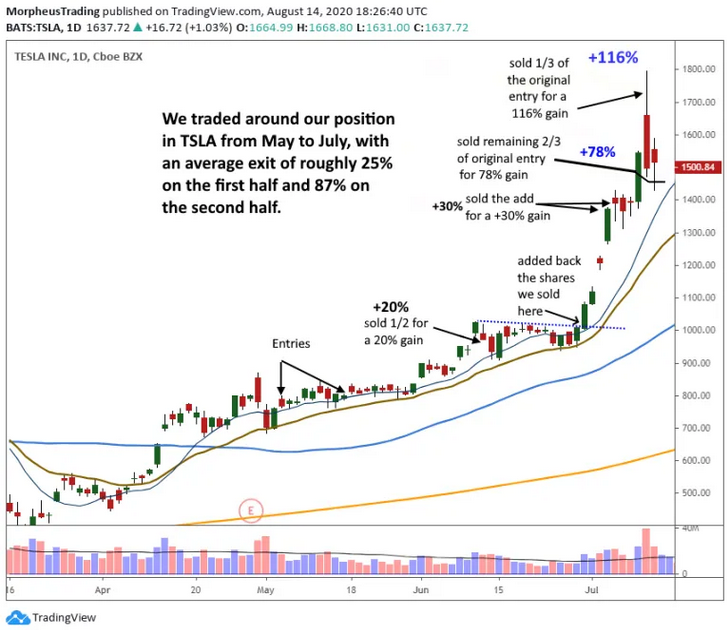
The chart below details all the exit points (and one add) as we traded around our Tesla position.
Be sure to also read our exact technical rationale for each exit level that follows:

After a strong thrust up in June, we sold half the position and locked in a gain of +20%.
After a few weeks of tight-ranged chop above the rising 20-day exponential moving average, we bought back the shares we sold after TSLA broke above its short-term downtrend line.
The added shares worked out right away, with the price exploding +30% higher in just four sessions.
We then sold our added shares in two parts into strength, securing gains of +34% and +31%.
This left us with the original half position, which was now trading +60% above our first entry point.
We wanted to give the original half position a wide enough stop to run, so we were looking for a close below the 10-day MA as a sell signal.
TSLA subsequently gapped up to new highs on July 13, but reversed lower after failing to follow through. This forced us to sell roughly 1/3 of the remaining position for a massive gain of +116%.
By the July 13 close, Tesla was about 15% below the day’s high with a ton of volume.
To protect against potential price exhaustion, we placed a protective stop beneath that day’s low.
The stop on our remaining shares triggered the next day, knocking us out of our remaining half position with a gain of +78%.
The Winning Formula
Tesla stock has recently become a household word because of its amazing performance in recent months.
However, our winning growth stock trading strategy once again helped us find this profitable gem well before everyone jumped on the Tesla bandwagon.
By regularly following the simple stock screening criteria detailed above, you will set yourself up to potentially find the next monster stock.
