

I’m very pleased to share with you that our Holmes Macro Trends Fund (MEGAX) beat its benchmark, theS&P Composite 1500 Index, for the 12-month period as of March 31. Whereas the benchmark returned 13.73 percent for the period, MEGAX returned an impressive 17.15 percent. We also have very favorable expectations for the fund for the remainder of this year, and beyond, because it's a model that emphasizes returns on invested capital (ROIC) and growing revenues.

MEGAX seeks to identify strong sectors, and, within those sectors, to identify companies that have the greatest potential for growth. We like to lean toward the “growthier” small- and mid-cap components of the broader S&P 1500, which covers about 90 percent of total market capitalization of the U.S. stock market.
An Appetite for Well Managed Companies
Specifically, we focus on companies that have a high ROIC as well as revenues that appear to be growing faster than their peers. We overweight companies whose shares are currently being accumulated by institutional investors and underweight names that, according to our technical overlay, show investor appetite is waning.
Finally, we omit companies that have low margins and low revenue per employee.

As an example of how we put our strategy into practice, we added Energizer Holdings (NYSE:ENR) last quarter after the company reported strong net earnings in fiscal year 2017. After taxes, the Energizer bunny reported $201.5 million in sales, or an incredible $3.27 per share. That’s up 58 percent from $127.7 million in 2016 and after a net loss of $4 million the previous year. In 2017, gross margin as a percent of net sales was 46.2 percent, an improvement over the 43.6 percent margin in 2016.
The position was well made, as Energizer charged up nearly 25 percent in the first quarter, making it one of the top performing stocks in the mid-cap S&P 400 index. Can the Energizer rally “keep going and going”? We’ll continue to study the bunny very closely.
Small Business “On Fire”
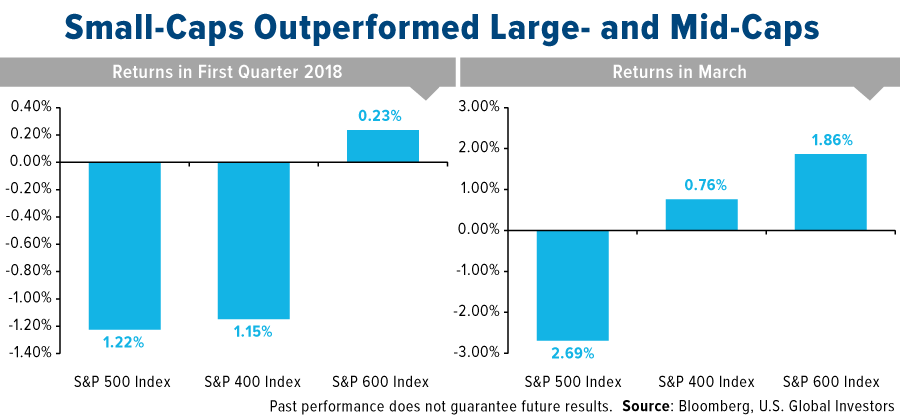
Our emphasis on smaller-cap, domestic-focused names has worked especially well as concerns over tariffs and global trade have lately hurt a number of shares of large multinationals with high exposure to foreign markets. As I shared with you just last week, small-cap stocks, as measured by the S&P 600 Index, finished positive for both the first quarter of 2018 and the turbulent month of March. They outperformed large-cap S&P 500 Index names as well as mid-cap stocks, represented by the S&P 400 Index. Please note, though, that small-caps, while they have higher returns here, also have a history of higher volatility than large- and mid-caps.
Consider what small business owners themselves are saying. The most recent monthly Index of Small Business Optimism, conducted by the National Federation of Independent Business (NFIB), came in at 107.6, the second-highest reading in the survey’s 45-year history. And 32 percent of small business owners say now is a good time to expand, the highest percentage ever. This optimistism comes in response to corporate tax cuts and the Trump administration’s pledge to roll back regulations.
Interested in learning more? I urge you to visit the Holmes Macro Trends Fund (MEGAX) page today!
---------------
Please consider carefully a fund’s investment objectives, risks, charges and expenses. For this and other important information, obtain a fund prospectus by visiting www.usfunds.com or by calling 1-800-US-FUNDS (1-800-873-8637). Read it carefully before investing. Foreside Fund Services, LLC, Distributor. U.S. Global Investors is the investment adviser.
Total Annualized Returns as of 3/31/2018:
FundOne-YearFive-YearTen-YearGross ExpenseHolmes Macro Fund (MEGAX)17.15%8.69%4.20%1.68%S&P 1500 Composite Index13.73%13.21%9.68%n/a
Expense ratio as stated in the most recent prospectus. Performance data quoted above is historical. Past performance is no guarantee of future results. Results reflect the reinvestment of dividends and other earnings. For a portion of periods, the fund had expense limitations, without which returns would have been lower. Current performance may be higher or lower than the performance data quoted. The principal value and investment return of an investment will fluctuate so that your shares, when redeemed, may be worth more or less than their original cost. Performance does not include the effect of any direct fees described in the fund’s prospectus which, if applicable, would lower your total returns. Performance quoted for periods of one year or less is cumulative and not annualized. Obtain performance data current to the most recent month-end at www.usfunds.com or 1-800-US-FUNDS.
Stock markets can be volatile and share prices can fluctuate in response to sector-related and other risks as described in the fund prospectus.
The S&P 1500 is a composite index that includes securities that account for 90% of the total market capitalization of the United States' stocks. The index includes small, mid and large cap stocks. The S&P 500 measures the value of stocks of the 500 largest corporations by market capitalization listed on the New York Stock Exchange or Nasdaq Composite. Standard & Poor's intention is to have a price that provides a quick look at the stock market and economy. The S&P Mid-Cap 400 Index tracks a diverse basket of medium-sized U.S. firms. A mid-cap stock is broadly defined as a company with a market capitalization ranging from about $2 billion to $10 billion. The S&P Small-Cap 600 Index consists of 600 small-cap stocks. A small-cap company is generally defined as a stock with a market capitalization between $300 million and $2 billion.
You cannot invest directly in an index.
The Small Business Optimism Index is compiled from a survey that is conducted each month by the National Federation of Independent Business (NFIB) of its members.
Return on invested capital (ROIC) is a calculation used to assess a company's efficiency at allocating the capital under its control to profitable investments. Return on invested capital gives a sense of how well a company is using its money to generate returns.
All opinions expressed and data provided are subject to change without notice. Some of these opinions may not be appropriate to every investor.
Fund portfolios are actively managed, and holdings may change daily. Holdings are reported as of the most recent quarter-end. Holdings in the Holmes Macro Trends Fund (MEGAX) as a percentage of net assets as of 3/31/2018: Energizer Holdings Inc. 2.47%.