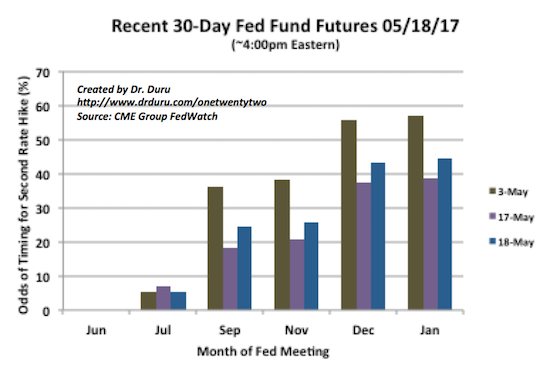
I am surprised Fed futures traders still firmly expect a rate hike from the U.S. Federal Reserve in June.

After the stock market sell-off in the wake of more Trump turmoil, the market pegged the odds of a June rate hike from the U.S. Federal Reserve at 64.6%. Above 50% means that more likely than not, the rate hike will occur in June. The odds bounced right back in the next day of trading to 73.8%.
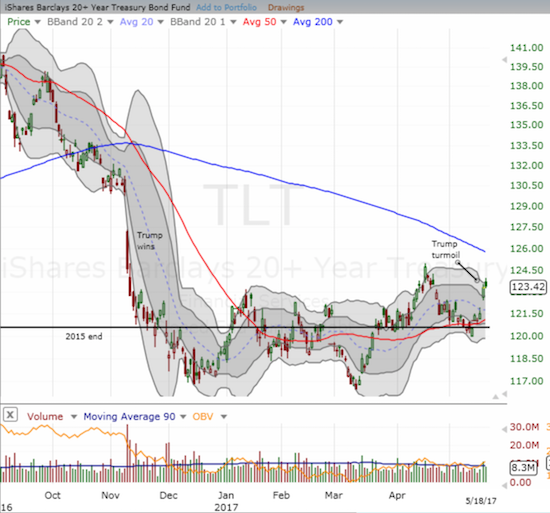
This resilience in June expectations is surprising given the viciousness of the selling and the accompanying drop in long-term interest rates. The drop in rates caused the iShares 20+ Year Treasury Bond ETF (NASDAQ:TLT) to gap up to a 1.4% gain on the day.

Despite all the accompanying drama on the day, TLT did not make a new high for 2017. While the turmoil was not enough to punch interest rates past the trading range or unseat June expectations, the turmoil DID take two rate hikes for 2017 clear off the table. After the Fed’s pronouncement on monetary policy on May 3rd, the odds of two rate hikes by December stood at 55.8%. After the day of Trump turmoil, those odds tumbled all the way to 37.6%. Futures traders recovered some of their confidence on the next day, but the odds are still well below 50%.

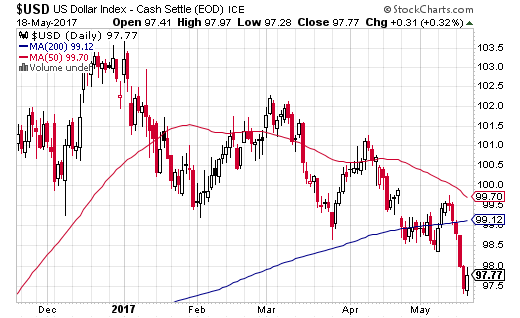
It is likely the plunge in odds for two rate hikes helped grease the skids for the U.S. dollar (DXY0) and confirmed a 200DMA breakdown. The dollar bounced back along with the odds of rate hikes.

At its intraday high, the U.S. dollar index managed to reverse all its losses from the previous day’s sell-off. The 200DMA breakdown remains well intact.
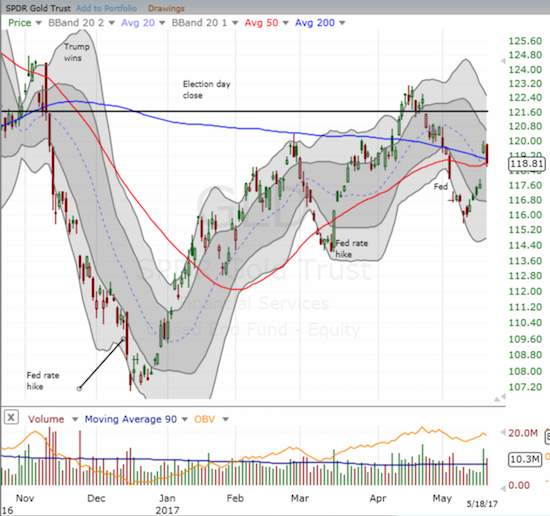
Gold has benefited where the U.S. dollar has lost. The latest rally swept the SPDR Gold Shares (NYSE:GLD) past resistance at its 50 and 200-day moving averages (DMAs). The gap up was impressive as it completed a full recovery from the Fed-inspired loss in the first part of May. The next day’s pullback stopped at 50DMA support. Since GLD is working on a nice rally of higher highs and higher lows from the December, 2016 Fed rate hike, this pivot around important DMAs takes on extra significance.

The SPDR Gold Trust (P:GLD) is pivoting around its 50 and 200DMAs. This is a critical juncture as it matches levels last seen when the Fed released its decision on monetary policy two weeks ago.
Even as the stock market begins to stabilize from the initial shock of an actual reaction to Trump’s increasing turmoil, I strongly suspect that rate-sensitive plays will continue to exhibit a lot of movement.
Be careful out there!
Full disclosure: net short the U.S. dollar, long GLD shares and call options
