We saw another fairly volatile and non-deliberate moving market. Last week we saw the big drop down through the longer-term support area, while this week we saw some big movements both up and down. In the end, the price action really didn’t produce much of a move from where it started on Monday. This week we will look at the current price patterns that are happening on the 3 major currency pairs.
Dow Jones Industrial Average

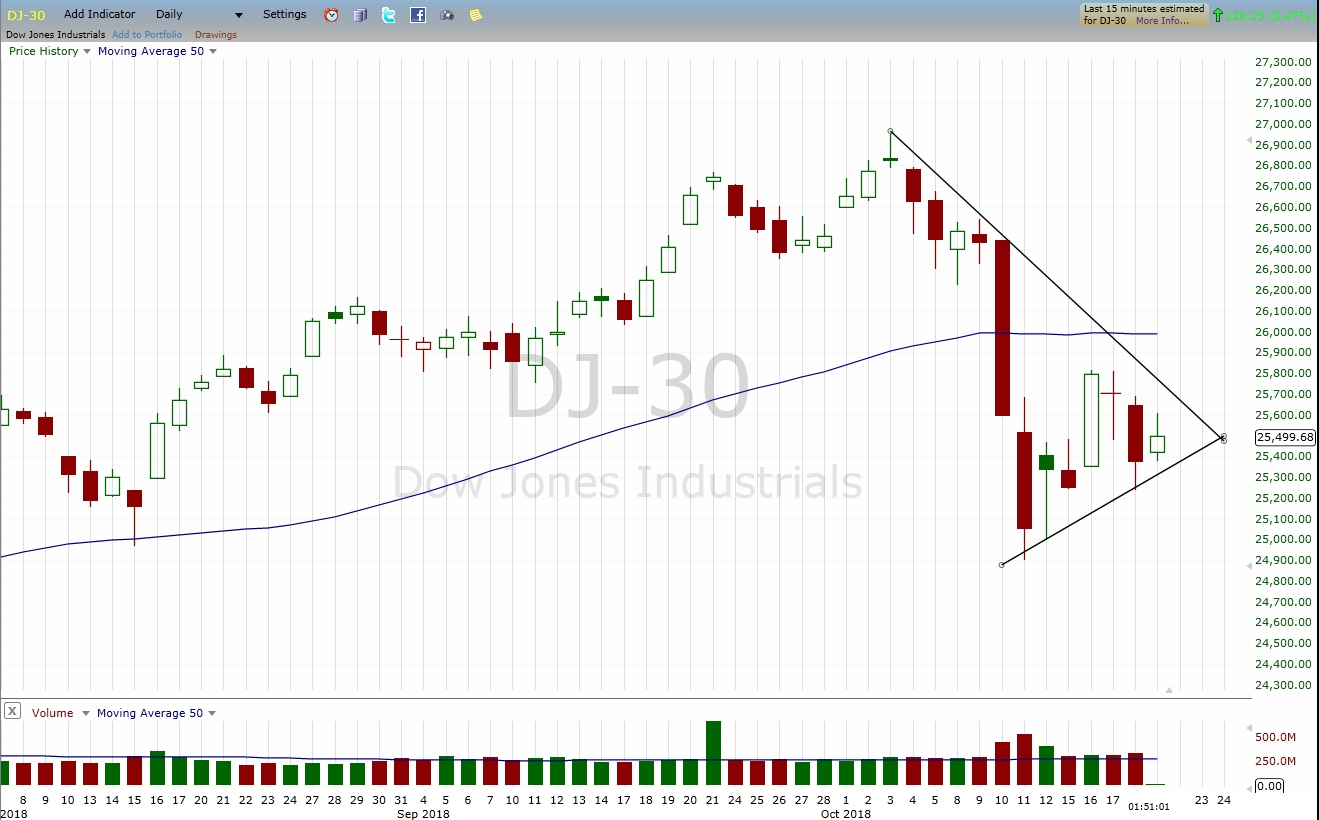
Last week we saw the price action move below the 50-period simple moving average, after being above it for the last several months. This move happened on an unusually wide range candlestick, on stronger than average volume. While this doesn’t guarantee a new trend down, it does suggest that the momentum has shifted from bullish to a more bearish direction. This week we have seen price move in a more sideways direction. In the chart above, you can see the consolidation that is developing. The overhead resistance is moving down, and the support line is moving higher causing a “triangle” formation. This type of price pattern is often times created prior to the price beginning another move, higher or lower. Right now, we will be watching to see if the price breaks out of the triangle price pattern. Once it does this, we will look for price to continue in that direction. As it breaks out, we will look for bullish or bearish setups to trade.
S&P 500

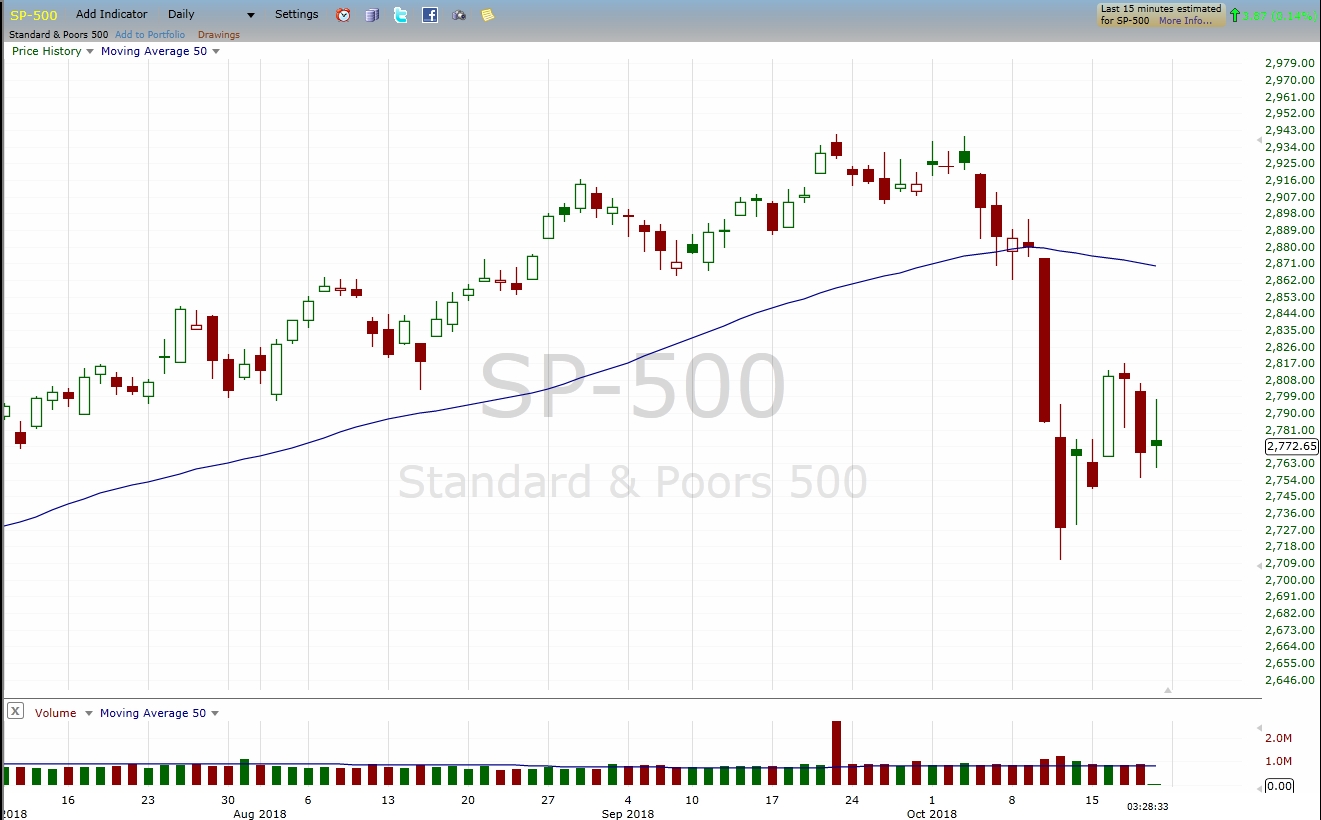
While the Standard and Poor’s 500 index looks very similar to the DJ-30, notice how the 50 SMA in this chart is moving lower while the DJ-30 is moving sideways. You can also see the same triangle price pattern where we will also be looking for a break of the support or resistance lines.
NASDAQ Composite

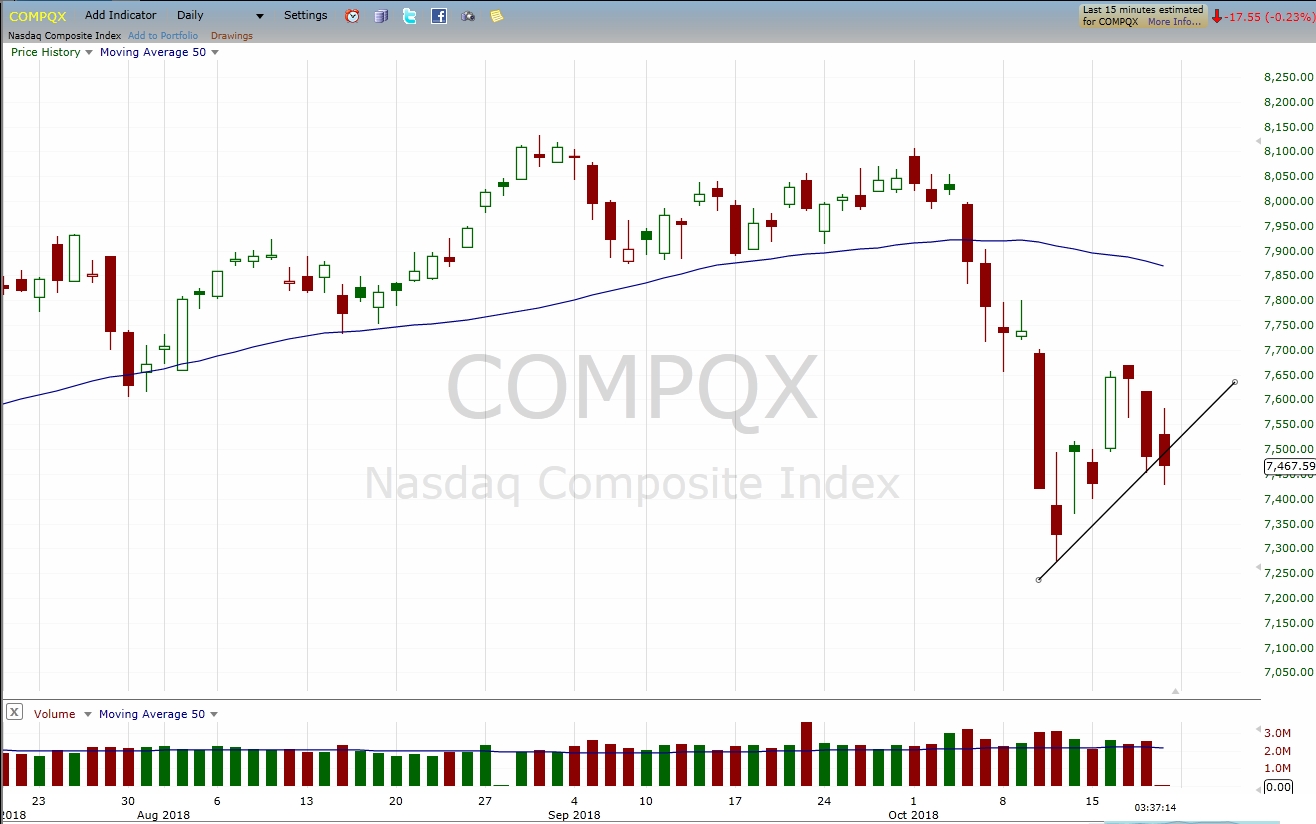
The NASDAQ Composite Index is much like the DJ-30 and SP-500 except that it looks like it is closing below the lower support line. This could be the beginning of another swing lower and pushing stock price down. We will continue to monitor and see if the other markets follow this push down.
So, why do we spend time looking at the charts of the major markets? Do we think they will show us future price action? Do we think they will predict where stocks may be moving to next week? Well, the answer is, when we see what the stocks are doing as a group, it can give us an idea of where the momentum of the price action is heading. While we can see on the charts where the price has been in the past, we can only use the current price direction to indicate that price may be moving in that same direction in the near future. So, if we see prices on the major markets moving lower, it can be expected to see the stocks in general move lower also. Looking at the current momentum is only one part of the overall picture. We also need to take into consideration how price reacts as it approaches and breaks through areas of support and resistance. That is why this week we need to consider what the price is going to do now that it is trading inside of the triangle price pattern. With the NASDAQ breaking lower we need to be aware of further downside movement in the markets this week. We should know pretty quick next week whether or not the other markets are going to follow. If not, we could see prices bounce back up once again.
Take some time to review what you are seeing on the market chart as well as charts on the stocks that you are trading. Identify the trend they are moving in and then where they are trading in relation to support and resistance.
