As Good As It Gets?
The S&P 500 share index had its best 12-month advance EVER from March 2020 to February 2021 on the back of the largest EVER liquidity injections from global central banks.
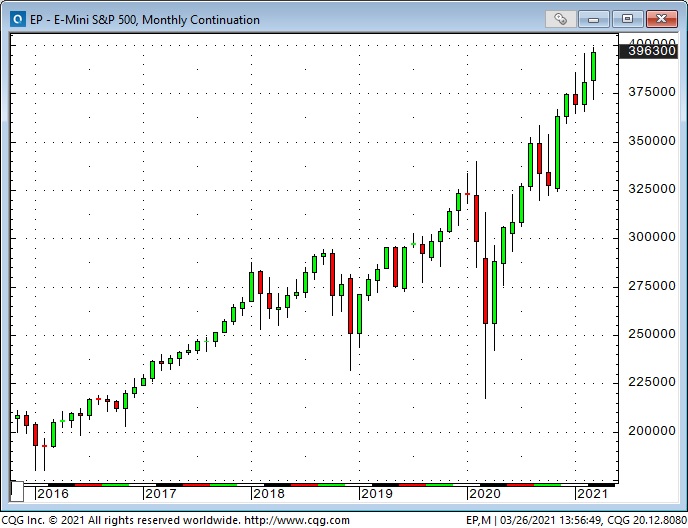
The major stock market indices made marginally higher highs in mid-March and then turned lower. In last week’s post, I proposed that we had seen a MAJOR TURN, that Peak Stimulus had come and gone, and I was short the Russell Small Caps Index and the Canadian dollar. (See my short-term trading report below.)
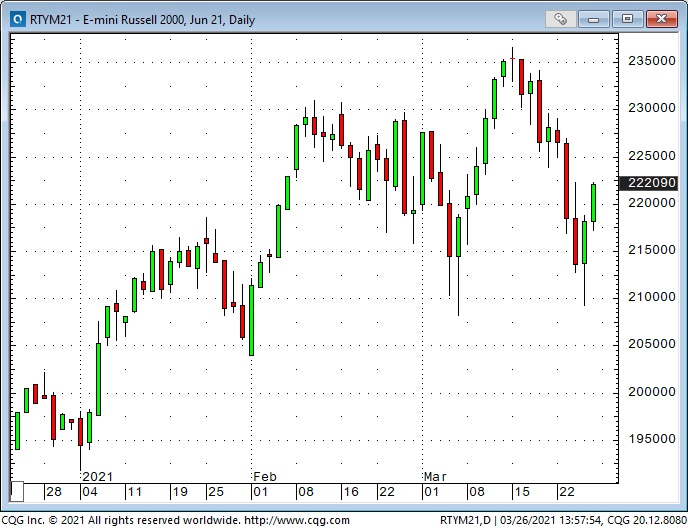
The Russell sold off early this week but bounced on President Joseph Biden’s Thursday press conference. He pledged that 200-million Americans would be vaccinated by the end of April and that he would launch a massive infrastructure rebuilding program to ensure that America stayed well ahead of China. His comments ignited buy-the-dip programs, and the major indices ended last week with a strong Thursday/Friday rally.
My main trading idea is that risk assets have been very aggressively bid and are WAY overdue for a correction. When late-to-the-party retail thinks it is easy to make >100% ROR, you should (at the very least) be phoning Uber (NYSE:UBER) and dancing out the exit door!
I’ve written about rotations from one sector to another in previous posts, but what I’m looking for now is a broad-based sell-off where things that have been bid the most aggressively fall the hardest. Within that context, “rotations” may mean that some things began falling from their highs before other things. The “everything rally” is done.
Equities
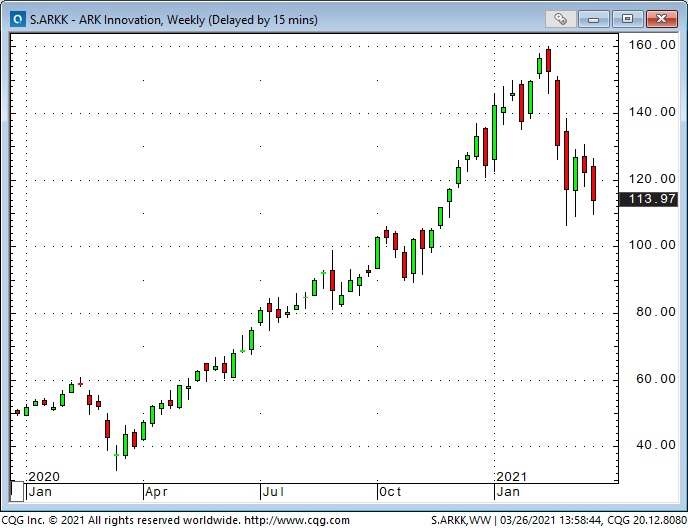
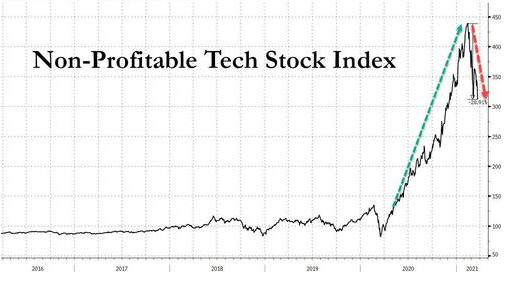
The ARK Innovation ETF (NYSE:ARKK) is a wonderful example of “things that had been bid the most aggressively fall the hardest.”
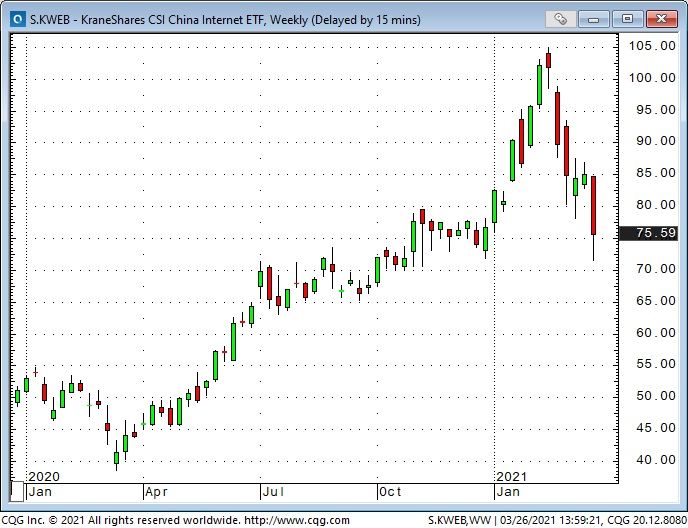
Chinese internet stocks also fit that description. Beijing appears to be reigning in risk with tighter monetary policy.
The Index of Non-Profitable Tech Stocks was bid aggressively (apparently, too aggressively) and has had a sharp tumble.
Interest Rates
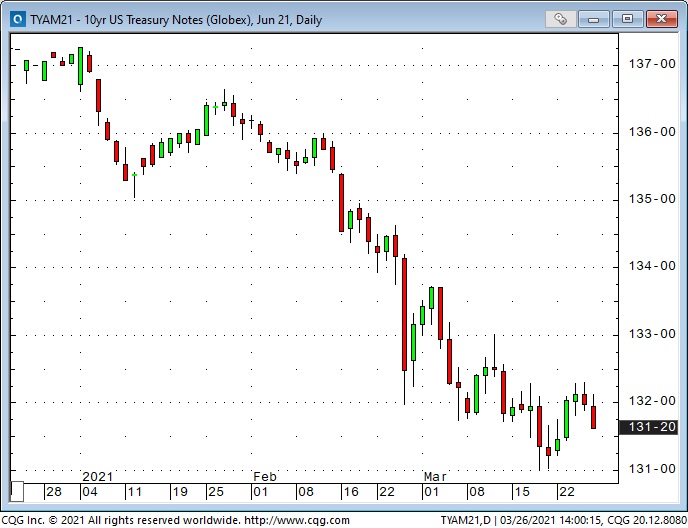
The yield on the 10-year Treasury hit an All-Time low ~0.50% last August but surged to ~1.75% last week. Bearish sentiment hit a multi-year extreme.
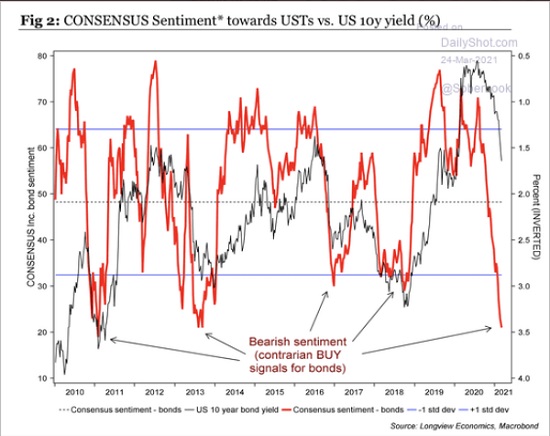
In last week’s post, I wrote, “Bonds are now extremely oversold, and if (for some reason) stocks and commodities start falling, bonds could jump.” I bought T-Notes Monday and sold them Wednesday.
Currencies
In previous posts, I’ve described the Jan. 6 low in the US dollar index as a critical “inflection point.” At that time, the popular thinking was that the USD was going to continue to trend lower. Speculators were positioned heavily short of the USD.
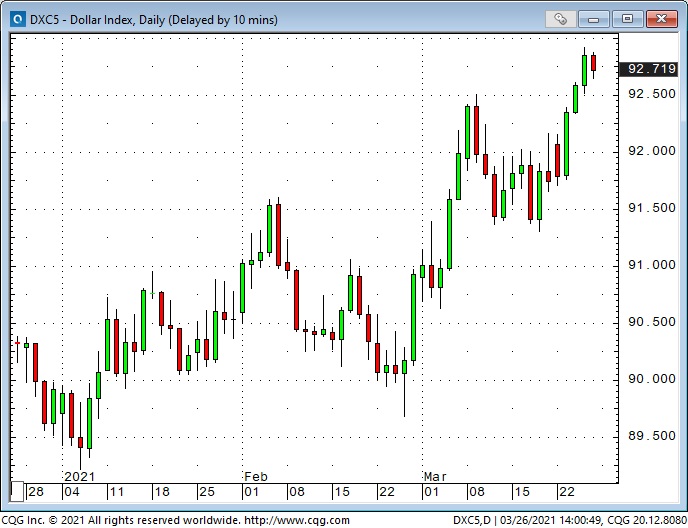
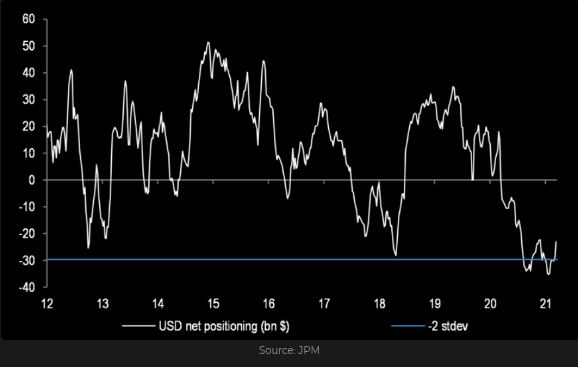
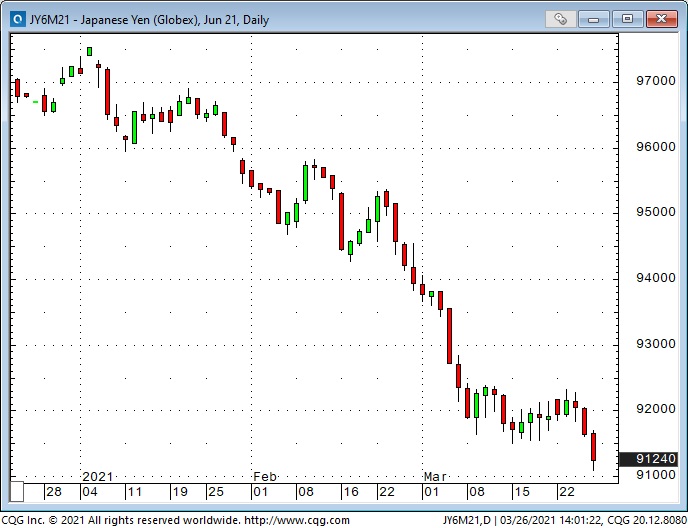
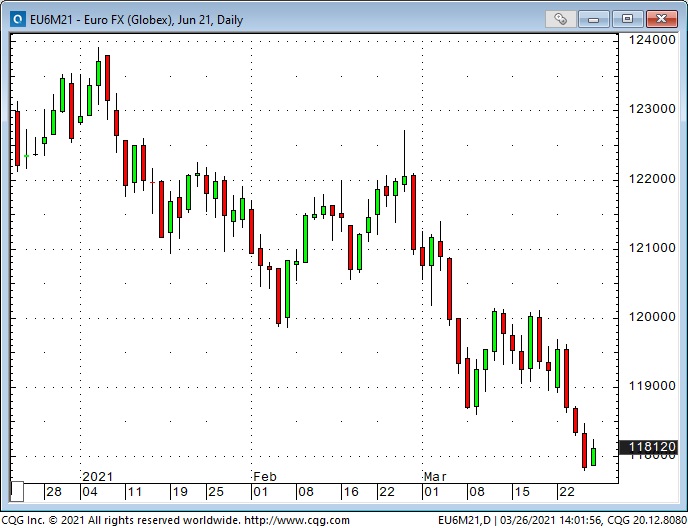
Since early January, the strength in the USD has mostly come at the expense of the European currencies (ex. the GBP) and the Japanese yen.
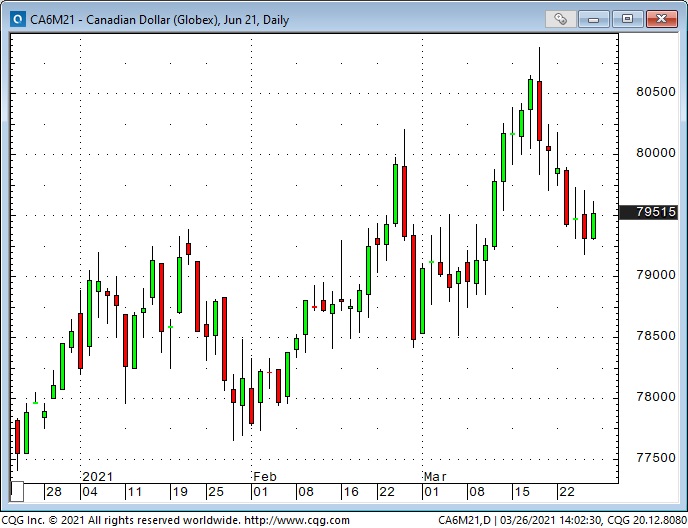
Commodity currencies (particularly the CAD) have done better against the USD as commodity indices surged to 2-year highs. However, just as in the equity markets, currencies that have been bid more aggressively are at risk of falling harder.
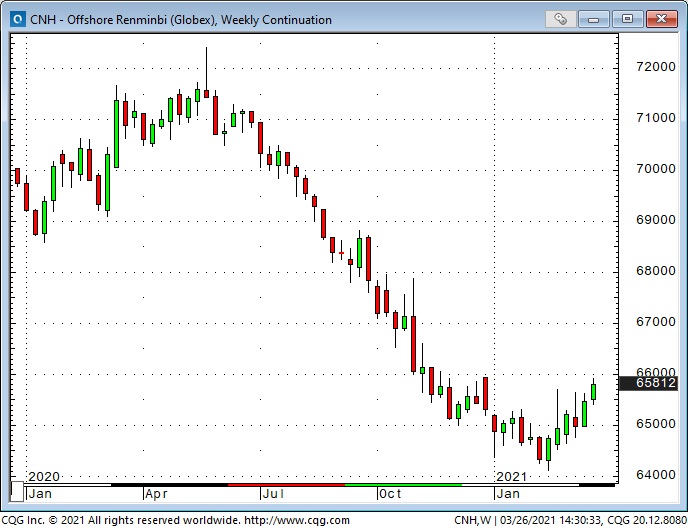
The Chinese renminbi has my attention. It is not one of the major currencies in terms of international volumes, but it is the currency of a MAJOR country—and it has been falling for the past several weeks. (In this chart, a higher price means that it takes more RMB to buy a USD.) You can imagine that other Asian nations watch RMB closely and “adjust” their currencies accordingly.
Commodities
WTI crude oil hit a 2+year high in early March but tumbled hard last Thursday when the broad stock market sold off. Inter-day price action has been wicked.
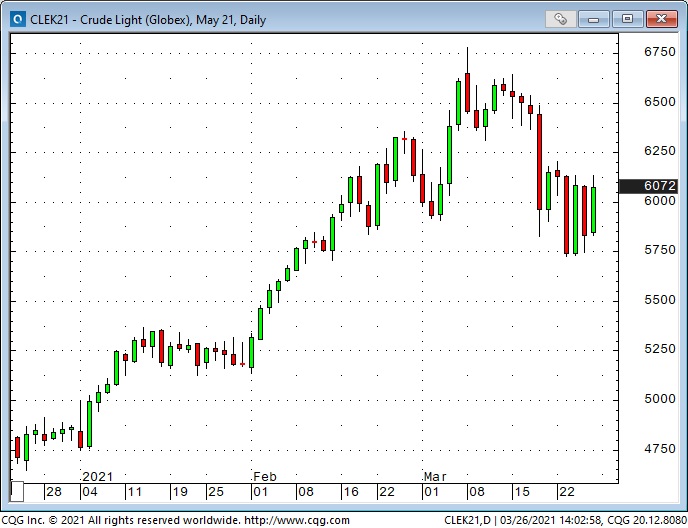
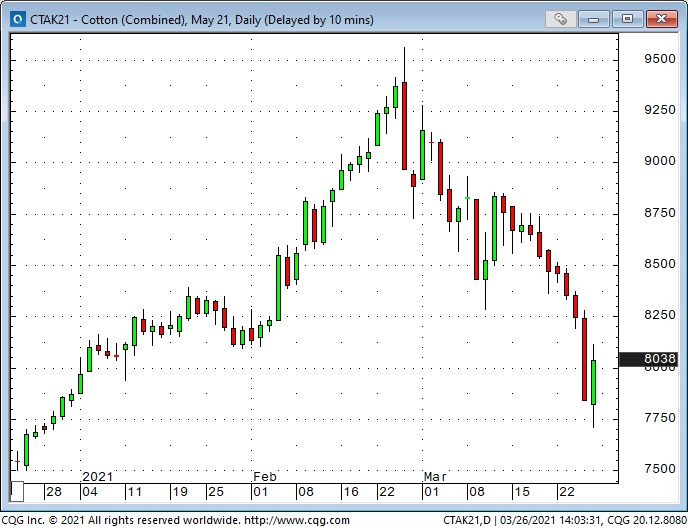
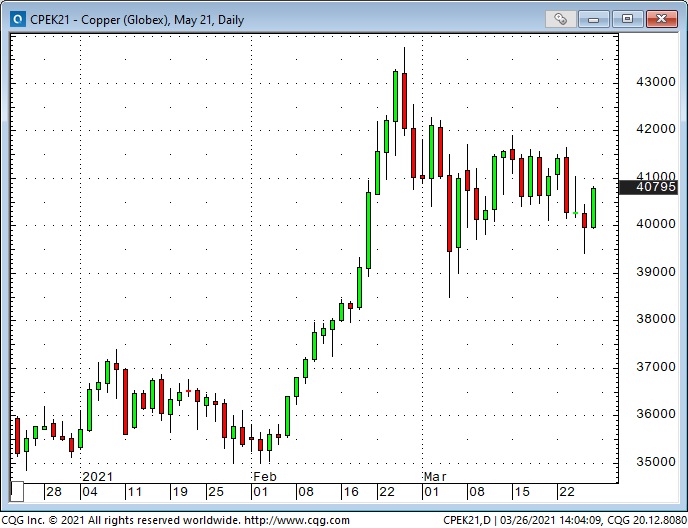
Crude oil has a large weighting in most of the broad commodity indices and could account for those indices breaking down. But it hasn’t just been weak crude oil—several commodity markets—from cotton to copper—have looked toppy lately after steep rallies the past several months. (Copper is key— it has been bought aggressively on the ESG story—if it breaks, that will be a solid signal that market psychology has changed.)
Gold
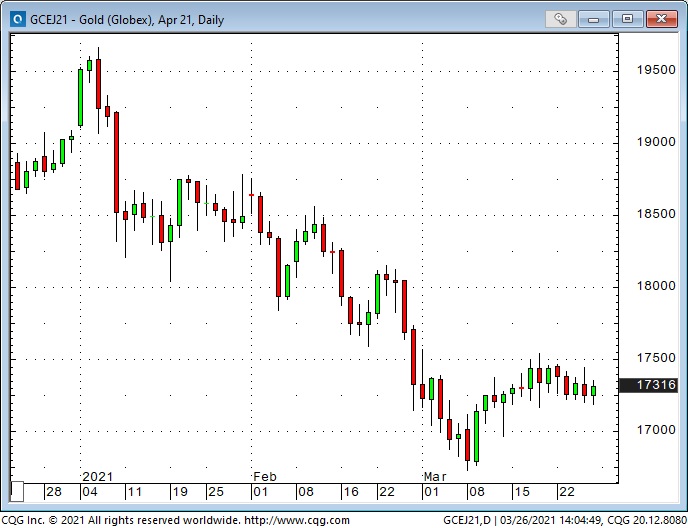
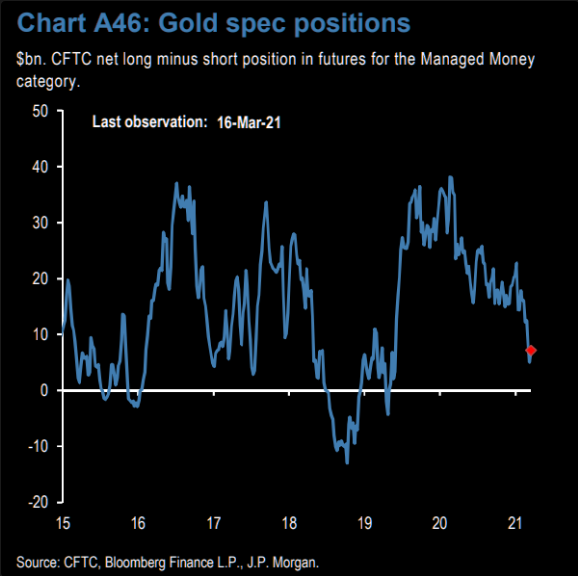
Gold has been “out of favor” this year while the USD and real interest rates have been rising. The ETF market was a huge source of buying leading up to the high last August, but since November, there has been significant net selling from that sector. Even though inflation expectations are rising, gold remains dull. I think gold will rally if/when we have FEAR across markets.
Futures market speculators are not buying gold.
My Short Term Trading
I started this week with short positions in the Russell and the CAD that were carried over from last week. Early in the week I added to the short CAD, shorted AUD and bought T-Notes. I was out of all of those positions with nice gains by Thursday.
I took a small loss shorting MEX Thursday and another small loss shorting Russell Friday. I bought CAD puts Friday, which is my only position at the end of the week.
On My Radar
I covered the short Russell position I established mid-day Friday because the market was closing strong, and I don’t like taking a losing position into the weekend. A market that rallies strong Thursday and Friday probably opens higher Monday. The Dow Jones Transports closed the week at an All-Time High.
I shorted the Russell Friday because I’m looking for the bounce off the Thursday lows to run out of steam and for the market to roll over and take out the week’s lows. However, I might be dead wrong about that, and I need to protect my trading capital.
This week I will be watching for signs that the current risk-on attitude is faltering.
