The S&P 500 index chopped up and down within a narrow range last week after surging ~9% the previous four weeks. Implied volatility was also choppy day-to-day, but it was close to one-year lows at the end of the week—a sign of complacency.
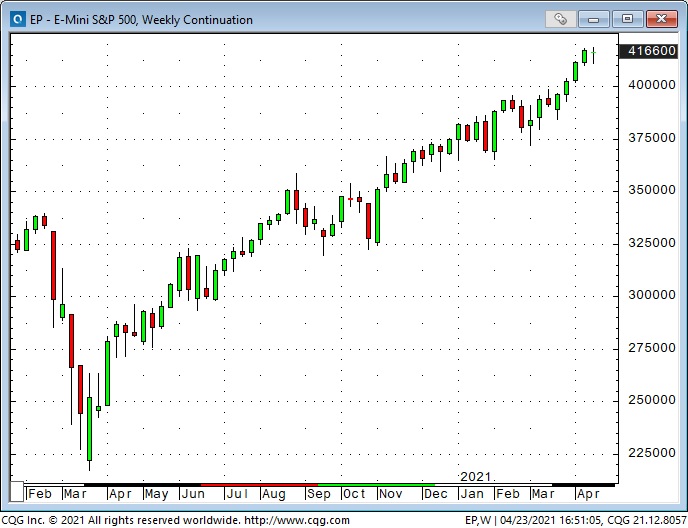
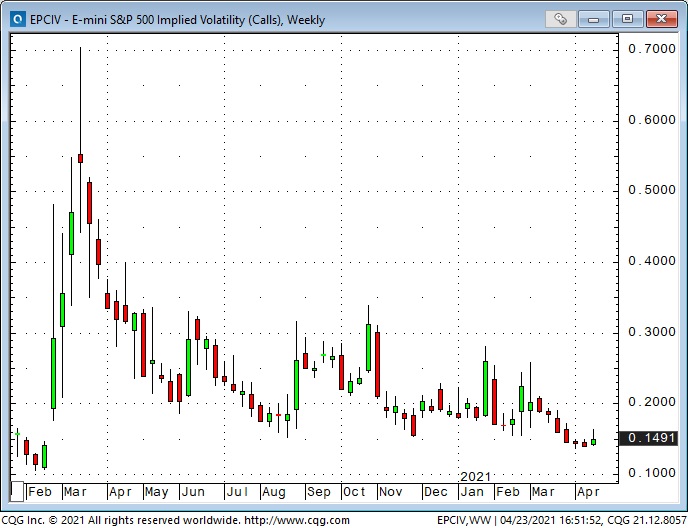
My view the past couple of weeks has been that the market is, once again, “priced for perfection” and is at risk of (at least) a mild correction sometime within the next few weeks. I’ve taken small, limited-risk positions in anticipation of a correction, but I’m wrong on that call so far. I’ll discuss my trade timing in the Trading section below.
The major stock indices have had spectacular rallies since the panic lows made in March last year. The S&P is up ~90%, the NASDAQ 100 is up ~110%, and the small-cap Russell is up ~135%. Last week I noted that the rally had been in two roughly equal parts, 1) March 2020 to November 2020, and 2) November 2020 to now.
What drove the rally?
The financial press would argue that ultra-accommodative Fed policy, massive fiscal stimulus, enormous capital flows, vaccinations and the anticipation of pent-up demand drove the second leg of the rally.
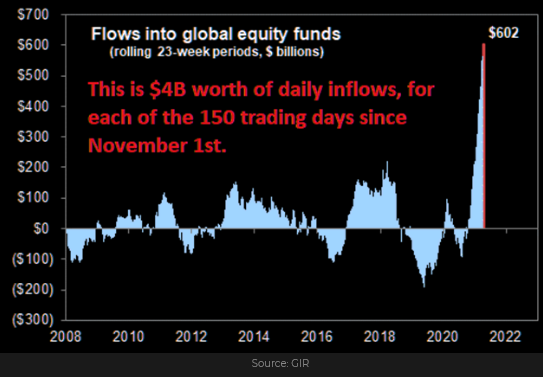
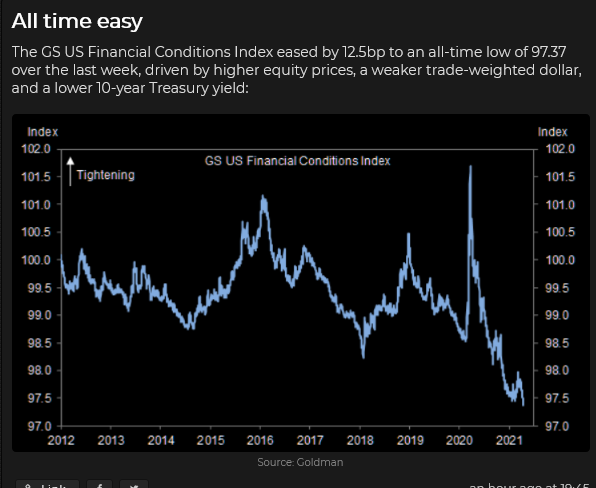
I would not disagree with any of that. But, I would add that exceedingly bullish and pervasive market psychology deserves much of the credit for driving parabolic rallies in things as fundamentally different as John Deere (NYSE:DE) Tractor shares and Bitcoin futures.
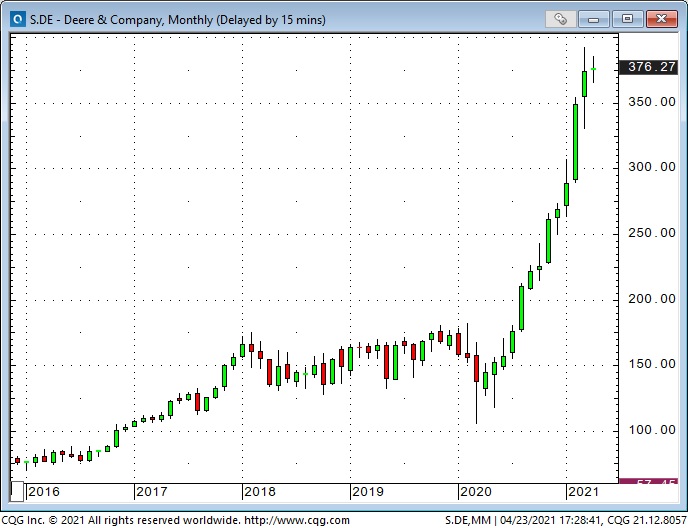
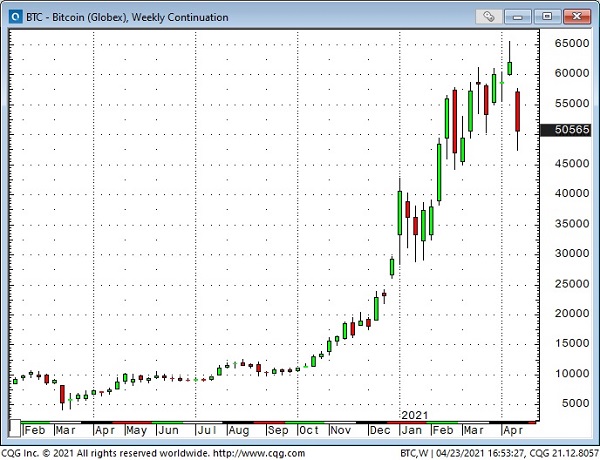
I would also add that “innovation” probably received too much credit for inspiring bullish enthusiasm. I’d argue that people understood (if only subliminally) that the purchasing power of their currency was being eroded by government and Central Bank stimulus.
So they went out and bought stocks and commodities and real estate. They understood that “saving money” was a dumb idea—borrowing money and buying “stuff” was the way to go. I’m afraid that some people who should be savers have instead become traders. I hope they get their timing right!
I sense that the bullish factors which have driven the market to its current levels are losing momentum. (And yes, I can hear Paul Simon singing, “A man sees what he wants to see and disregards the rest.“)
When people aggressively buy things, when the hurdle rate on the cost of borrowing money is zero, Wall Street will churn out products to meet demand—and people will make bad investment decisions. With apologies to Nassim Taleb, I think market conditions are currently very fragile.
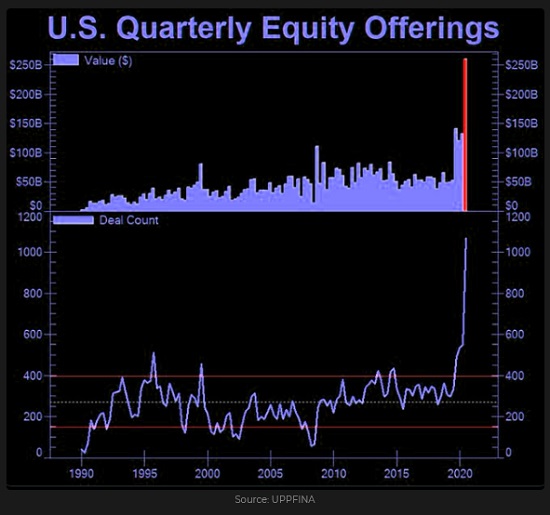
What could spoil the mood?
Two things happened at the beginning of November that accelerated the rally: 1) Joseph Biden was elected, and 2) Pfizer (NYSE:PFE) announced the vaccine. The re-opening optimism is based on putting the virus behind us. If there is ANY real doubt about that, the markets will correct.
Biden will get tested. All Presidents do. (Trump certainly didn’t expect COVID.) So far, Biden has been on a honeymoon in terms of mostly getting what he wants. That will change. It might be losing a political showdown in DC, or it might be having to respond to an international geopolitical event.
There is WAY too much leverage in the markets, and another Archegos will show up. If it inspires widespread selling, liquidity may disappear, and people will get a whole new appreciation of what “fragile” means!
The Canadian dollar: Bank of Canada surprise
I bought 79 strike CAD puts at the end of March when the CAD was ~7950. I thought that if the CAD dropped below 79 cents, it would build downside momentum. However, it drifted sideways for the next three weeks in a narrow range and time decay ate into my option premium.
My risk management plan was to sell the puts if the CAD closed above 80 cents. It traded above 80 cents a few times, but quickly fell back, so I stayed with the trade.
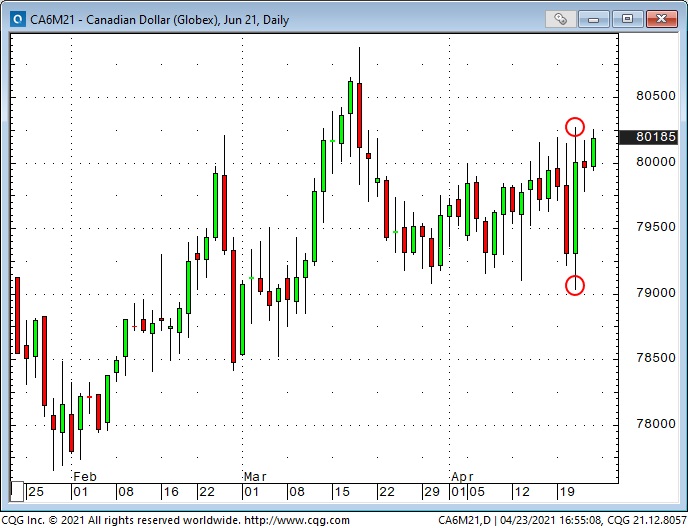
On Tuesday last week, the CAD traded briefly above 80 cents but was rejected hard and fell to ~7925 (both stocks and WTI—which have a big influence on the CAD—were down Tuesday.)
Wednesday morning before the scheduled BoC meeting, the CAD dropped to just above 79 cents (and I was thinking, “here we go,“) but then the BoC shocked the market with a much more hawkish tone than had been expected, and the CAD rallied more than a full cent to close above 80 cents. I covered the puts, losing about 80% of what I had paid for them.
Last week’s Canadian Dollar close was the highest in 39 months.
The US dollar: weaker in April as US interest rates fell
The US dollar index (USDX) hit a 33-month low in January, but then rallied nearly 5% to the end of March, as US bond yields surged higher. Since the March highs, the USDX has weakened as US yields fell while European yields rose.
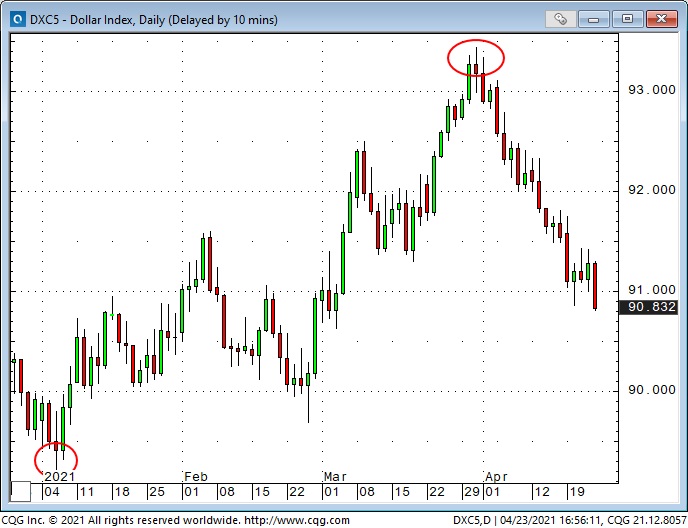
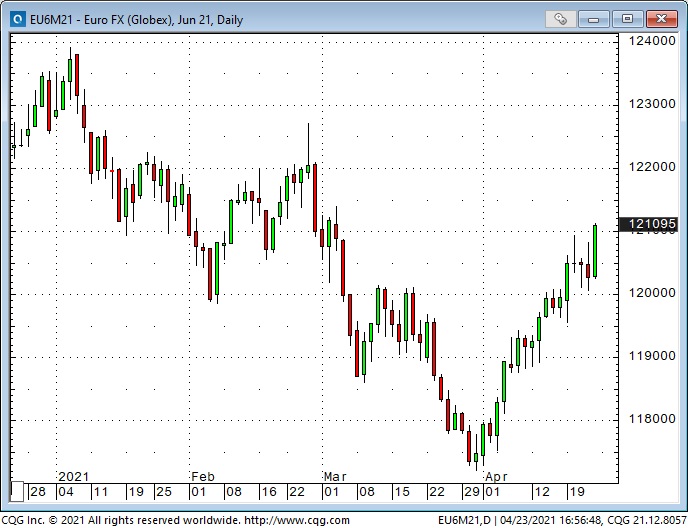
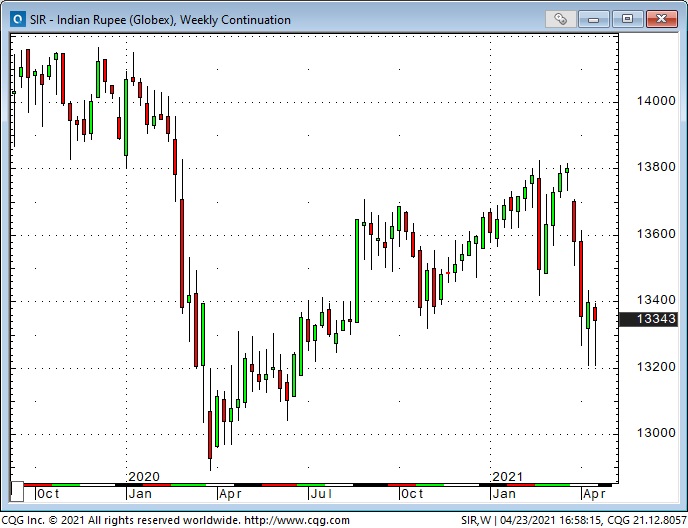
The continental European currencies rallied ~3% against the US Dollar in the last four weeks. Nearly all of the widely traded currencies made gains against the USD during April. The Indian rupee is the exception—it has fallen against nearly all currencies as India struggles with the virus.
Gold: rallied in April as the US dollar weakened
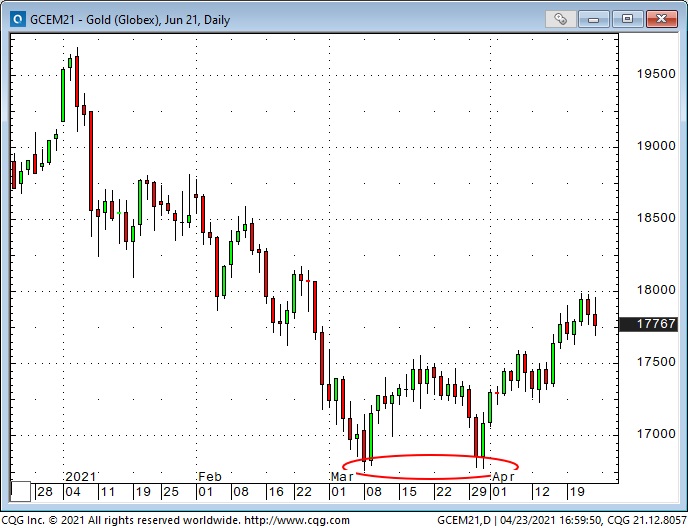
Last week I noted that gold had a strong negative correlation with the USDX since January. Gold made its high for the year in early January as the USDX made its low, and vice versa at the end of March. Gold has rallied ~$125 following a classic double bottom in March.
WTI crude oil: drifting sideways after doubling from November to March
WTI crude oil had a 2-legged rally from last year’s lows—somewhat similar to the 2-legged rally in stocks—with both markets starting their 2nd leg advance at the beginning of November. WTI had a much stronger 2nd leg than stocks, with prices doubling from November to March, from ~$34 to ~$68.
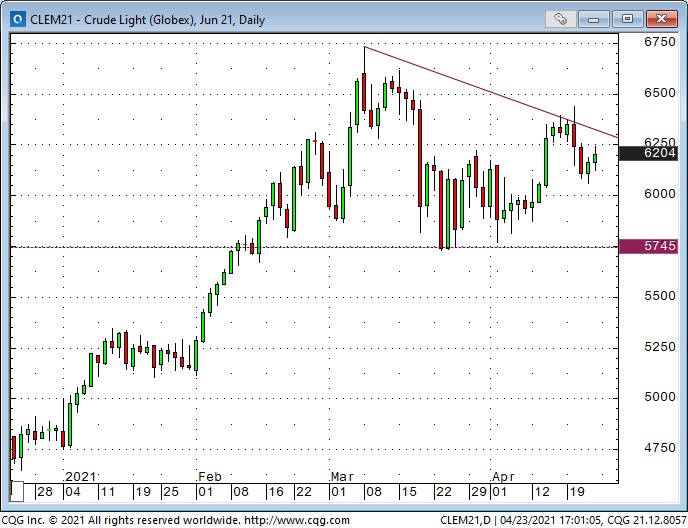
Futures market speculators were aggressive buyers during the WTI rally (and were especially aggressive in buying WTI time spreads—looking for front month contracts to rise relative to deferred month contracts.)
I established a bearish put spread strategy (long 56.50 strike / short 53.50 strike June puts) on Apr. 7, looking for WTI to break the support around 57.50. The net delta on the trade was ~13%; the net Vol was negative 3.
Commodities: sizzling!
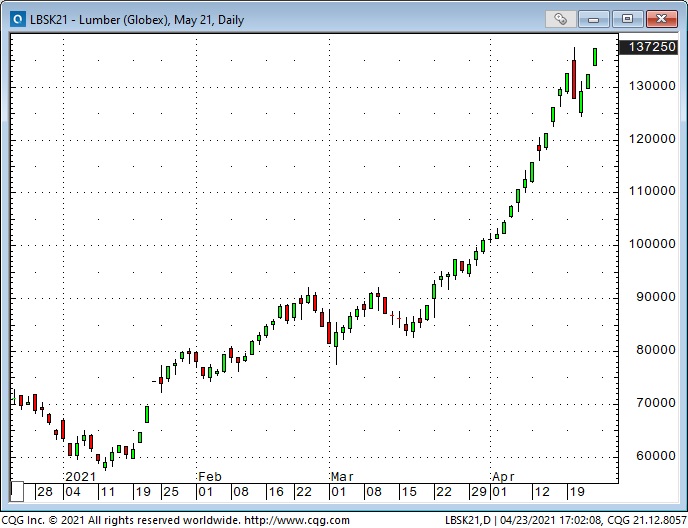
Lumber has been hotter than Bitcoin ever was!
Warning: Lumber futures are in severe backwardation—the front months are trading at huge premiums to the deferred months. Second warning: there is NOT a lot of liquidity in lumber futures—the contracts are frequently locked limit—mostly limit up, but sometimes limit down!
There are few trading experiences as terrifying as being trapped in a thin futures market that is locked limit against you!
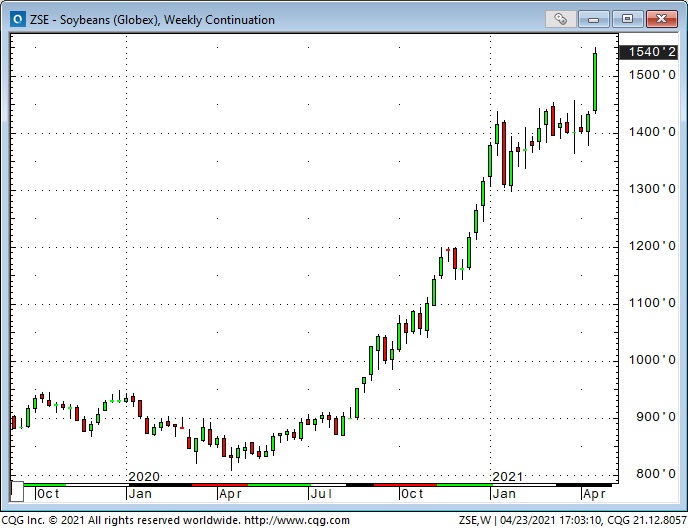
The Ag markets have been red hot—soybean prices have doubled from last year’s lows—the rally in corn has been even stronger.
My short term trading
In addition to the option trades in the CAD and WTI, noted above, I’ve done these stock index trades:
Russell small cap index:
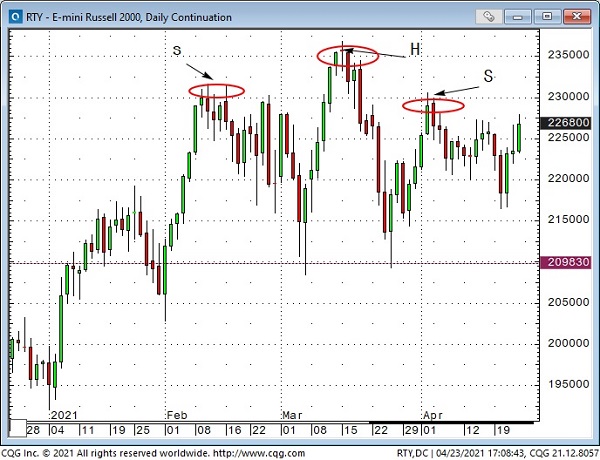
My favorite way to express a bearish view on stocks the past 6 weeks has been to short the Russell. It has been the weakest of the major stock index futures. I most recently sold it around 2250 in early April.
It drifted sideways to lower while the other indices rallied. The Russell broke down nicely Monday/Tuesday last week, and I thought if it could break 2100, it would be a classic Head & Shoulders top. I moved my stop to break even and was stopped Thursday when the Russell rallied while the other major indices fell—rotation, I guess!
S&P options
I bought 3800 strike S&P puts Apr. 8 as the S&P closed the week at ~4105. These puts were well out-of-the-money with a 15% delta. Implied vol was near a 1-year low. The puts were cheap, in part, because nobody was interested in buying puts. After all, stocks only go up!
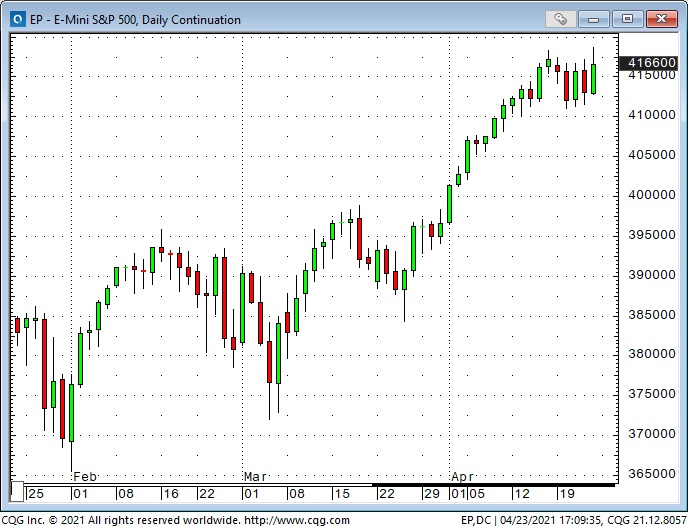
The common theme in all four trades noted here has been my expectation that bullish enthusiasm has run “too far, too fast” and that there would be (at least) a correction. So far, I’ve been wrong about that and none of these trades have been making me any money.
I’ve kept my trading size small and/or used limited risk options strategies because I’m trying to “top pick” a strong trend and I’m trading an “idea” instead of a specific “set-up” which means I don’t have a defined risk point in terms of price or time. Yikes!
A change in trading style
These four trades also represent a “change of style” in my trading. I reviewed all of the trades I made over the past 2 years and noticed that I had several good “calls” on different markets but didn’t capitalize as much as I thought I should have on those trades. The common “error” was having initial stops too tight or moving stops to break even or to lock-in gains too quickly.
My conclusion was that if I reduced my size (or used option strategies) I could reduce my capital-at-risk and not need to have my stops as close. This would probably allow me to stay with positions longer, which meant I would be keeping the time frame of my trading in sync with the time frame of my analysis.
Protecting capital – sizing trades
Protecting my trading capital is the most important thing I can control. My key question is always, “What am I going to do if I’m wrong—how will I know I’m wrong?”
If I’m “totally wrong” on all four of these trades, my max loss would be ~1.5% of my trading capital. I’m already out of the Russell at break even, and I got back 20% of the premium I spent on the CAD puts, so my max loss if both the S&P and the WTI options expire at zero is probably around 1%, and I probably won’t let them go to zero.
You might think my trading size is too small; that I should be more aggressive. I know that when I’m in a trade that is really working, I will wish (in the back of my mind) that I had a bigger position. But my 50 years of trading experience tells me that I have no idea what will happen in any market. I don’t want any trade to be important. I’m not trading for excitement—I’m just trying to grind out a living.
If WTI and the S&P have a good correction within the next month, I’ll probably come out of these trades money ahead—and I’ll try to add to my positions!
When I started these posts, I commented that I wanted to write about my trading, why I did what I did, and what I learned from the experience. I hoped that would help my readers with their own trading and investing. To do a proper job, I need to write openly about my losing trades, not just my winning trades.
On my radar
If the market moves in my favor, I will try to add to my existing positions. I’ll also be looking for an opportunity to get back on the short side of the Canadian Dollar.
