
Summary:
- The stock market fell last week, with the S&P 500 (SPX) down 26 points to 2754, a decline of 0.9%.
- Trade jitters continued to press on stocks, primarily the Dow - but led by the Russell 2000, stocks started lower and then pushed higher on most days.
- Our projection this week is for stocks to attempt a rally to 2775, but then fail to 2742.
While the S&P 500 finished the week lower, stocks started nearly every day lower and then rallied during the regular trading session. This week also brought the continued divergence between the major stock indexes. The large companies in the Dow Jones fell 2% on the week while the small firms in the Russell gained 0.8%. This was due in part to an expectation that protectionist trade policies may expose the Dow’s multinational companies to greater risks.
On Monday, the S&P 500 fell 0.3% to 2773. Markets opened lower after China announced retaliatory measures in response to President Trump’s threat to impose 25% tariffs on $50 billion worth of Chinese goods. However, led by small caps, stocks rallied for most of the regular trading session, which cut losses significantly.
On Monday evening, Trump threatened another $200 billion in tariffs on Chinese goods, which pushed stock futures lower. The Senate then passed a bill that would reimpose the sanctions on Chinese technology giant ZTE. This may have added to the downward pressure as Trump was using the ZTE sanction as a bargaining chip in the trade negotiations.
On Tuesday, the S&P 500 fell 0.4% to 2762. With stocks opening lower, they again rallied led by the Russell, which finished the day in positive territory. The Dow also attempted to rally but finished the day 1% lower. Meanwhile, May building permits missed expectations at 1.3 million compared to estimates of 1.35 million and the April figure of 1.36 million.
On Wednesday, the S&P rose 5 points, after the European Union announced $3.2 billion in retaliatory trade measures. These will include not only automobiles but also bourbon and Harley-Davidson (NYSE:HOG) motorcycles. Similar to the Chinese tariffs, the Europeans targeted states that voted for Trump in the 2016 election.
On Thursday, the S&P 500 fell 0.6% to 2750. Daimler warned that it expected the evolving trade war to affect its bottom line, which pushed the auto sector lower. As well, the Philadelphia Federal Reserve announced the June reading for its manufacturing index at 19.9, below estimates of 28.9 and the May figure of 34.4.
On Friday, the stock market rose 4 points to 2754, after OPEC came to an agreement that it would increase oil production by 1 million barrels per day. Remarkably, oil futures rose over 5% on the day. This could imply that investors expected a larger increase. Yet one member country commented that the actual increase could be less due to a weakened ability to increase output on the part of Iran and Venezuela.
Given last week’s active news cycle, volatility remained relatively subdued, with the VIX ranging between 12.25 and 14.74. This was due in part to the fact that stocks rallied every session except for Thursday. Should this give us greater confidence in the strength of the market? Or does this imply that worsening conditions could lead to a broader sell off?
Our Projection for the S&P 500 This Week
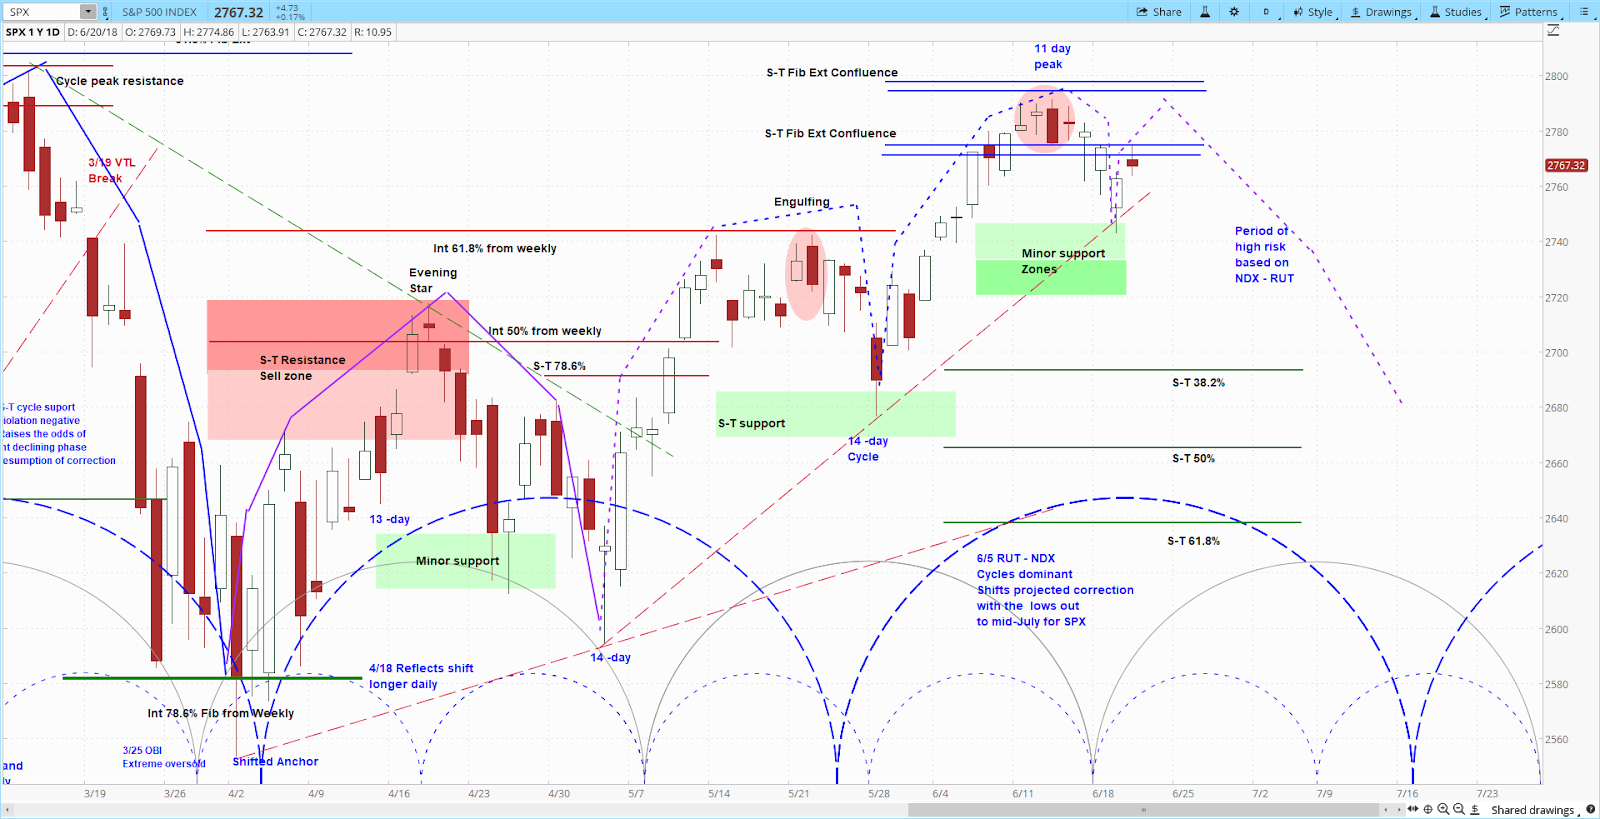
According to the askSlim Stock Index Report for this week, our analysis is that the S&P 500 will attempt to rally to 2775, but then fail and fall to the 2742 area. A break below 2742 would increase downside risks significantly. In the following weeks, we expect more downside, namely decline of 75-125 points. Our analysis is depicted on the chart above, with the brackets on the bottom representing the market cycles.
For an introduction to cycle analysis, check out the askSlim Market Week show every Friday on our YouTube channel. The latest episode is below.