
Toyota Motor Corporation (NYSE:TM) recorded earnings of ¥179.11 per share ($3.32 per ADR) in first-quarter (ended Jun 30, 2016) fiscal 2017, compared with ¥205.30 per share ($3.37 per ADR) earned in first-quarter (ended Jun 30, 2015) fiscal 2016. Earnings per ADR comfortably surpassed the Zacks Consensus Estimate of $2.30. The Japanese automaker reported consolidated net income of ¥552.5 billion ($5.11 billion) in first-quarter fiscal 2017, down from ¥646.4 billion ($5.34 billion) posted in the year-ago quarter.
Consolidated revenues decreased 5.7% year over year to ¥6.58 trillion ($61 billion) in the reported quarter. However, the figure outpaced the Zacks Consensus Estimate of $59.22 billion.
Unit sales went up 2.8% year over year to 2.17 million vehicles globally. Sales improved 8.8% to 511,170 units in Japan, 7.9% to 222,708 vehicles in Europe, 16.9% to 384,171 units in Asia. However sales declined 1.8% to 715,384 vehicles in North America and 10.8% to 339,226 units in other regions (Central and South America, Oceania, Africa and the Middle East).
Operating income decreased 15% to ¥642.2 billion ($5.9 billion) from ¥756 billion ($6.3 billion) a year ago. The decline was due to unfavorable foreign exchange rates, partially offset by cost-reduction and marketing efforts.
TOYOTA MOTOR CP Price, Consensus and EPS Surprise
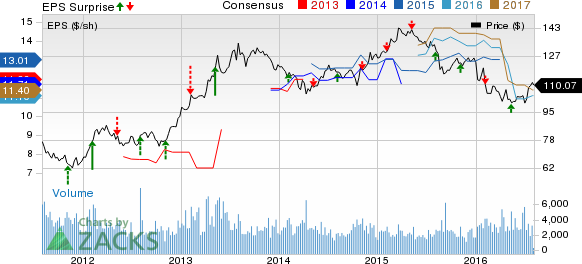
TOYOTA MOTOR CP Price, Consensus and EPS Surprise | TOYOTA MOTOR CP Quote
Segment Results
The Automotive segment’s revenues dropped 6% to ¥6.03 trillion ($55.8 billion) in the reported quarter, while the operating income plunged 19.8% to ¥543.4 billion ($5.03 billion).
The Financial Services segment’s revenues went down 6.7% to ¥438.9 billion ($4.06 billion), while the operating income increased 28.7% to ¥90.2 billion ($835.2 million).
All Other businesses’ revenues dropped 3.1% to ¥249 billion ($2.3 billion). Operating income also declined 15.6% to ¥10.3 billion ($95.4 million).
Financial Position
Toyota had cash and cash equivalents of ¥3.27 trillion ($30.3 billion) as of Jun 30, 2016, compared with ¥2.93 trillion ($25.6 billion) as of Mar 31, 2016. Total debt amounted to ¥17.1 trillion ($158.7 billion) as of Jun 30, 2016 compared with ¥18.29 trillion ($159.1 billion) as of Mar 31, 2016.
In first-quarter fiscal 2017, operating net cash flow was ¥1.18 trillion ($10.9 billion) compared with ¥1.12 trillion ($9.3 billion) recorded in the year-ago period.
FY17 Guidance
Toyota reduced its consolidated revenue guidance to ¥26 trillion ($254.9 billion) for fiscal 2017 from the previous forecast of ¥26.5 trillion ($259.8 billion). The revenue guidance also reflects an 8.5% decline over fiscal 2016.
Operating income guidance has been lowered to ¥1.6 trillion ($15.7 billion) from the previous forecast of ¥1.7 trillion ($16.6 billion). The revised guidance implies a 43.9% year-over-year decrease.
Net earnings are expected to be around ¥1.45 trillion ($14.2 billion), down from the prior view of ¥1.5 trillion ($14.7 billion). The net income guidance reflects expectations of a 37.3% decrease over fiscal 2016.
Toyota also expects consolidated vehicle sales to be 8.90 million units in fiscal 2017.
Zacks Rank
Currently, Toyota carries a Zacks Rank #3 (Hold).
Some better-ranked automobile stocks include The Goodyear Tire & Rubber Company (NASDAQ:GT) , Johnson Controls Inc. (NYSE:JCI) and Gentex Corp. (NASDAQ:GNTX) , each carrying a Zacks Rank #2 (Buy).
TOYOTA MOTOR CP (TM): Free Stock Analysis Report
JOHNSON CONTROL (JCI): Free Stock Analysis Report
GENTEX CORP (GNTX): Free Stock Analysis Report
GOODYEAR TIRE (GT): Free Stock Analysis Report
Original post
Zacks Investment Research