Here are the Rest of the Top 10:
Nordstrom, Ticker: JWN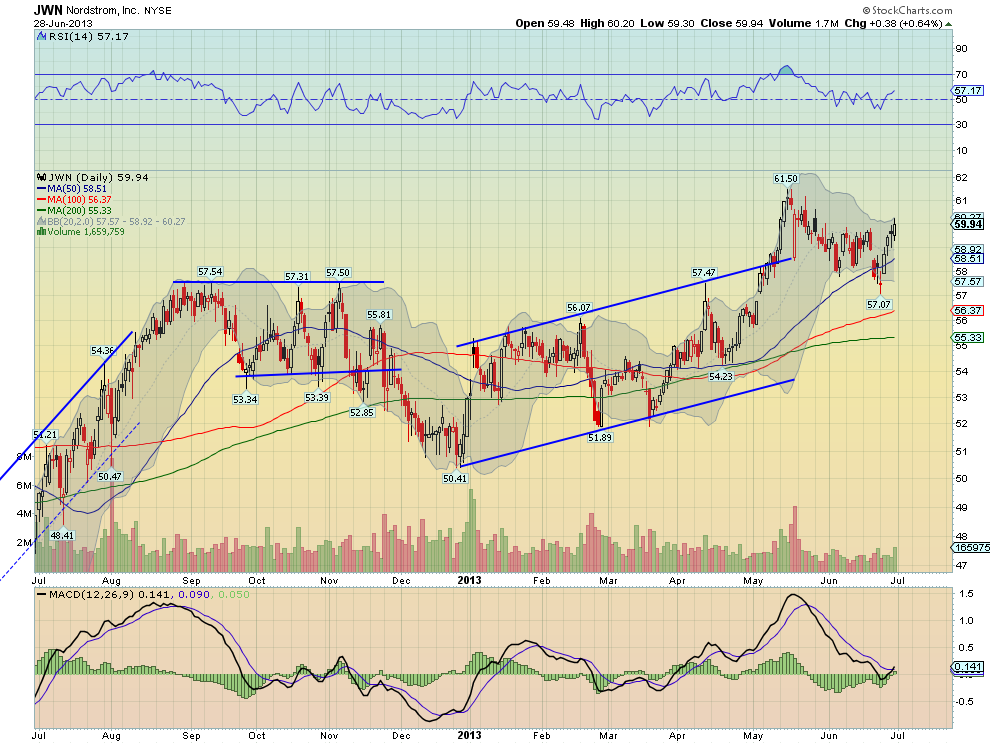
Nordstrom, JWN, is moving above short term resistance after a short stint below the 50 day Simple Moving Average (SMA). The Relative Strength Index (RSI) is bullish and moving higher again, after it held bullish throughout the pullback. The Moving Average Convergence Divergence indicator (MACD) is crossing higher in the signal line and histogram as it turns higher. Both support further upside price action.
Lockheed Martin, Ticker: LMT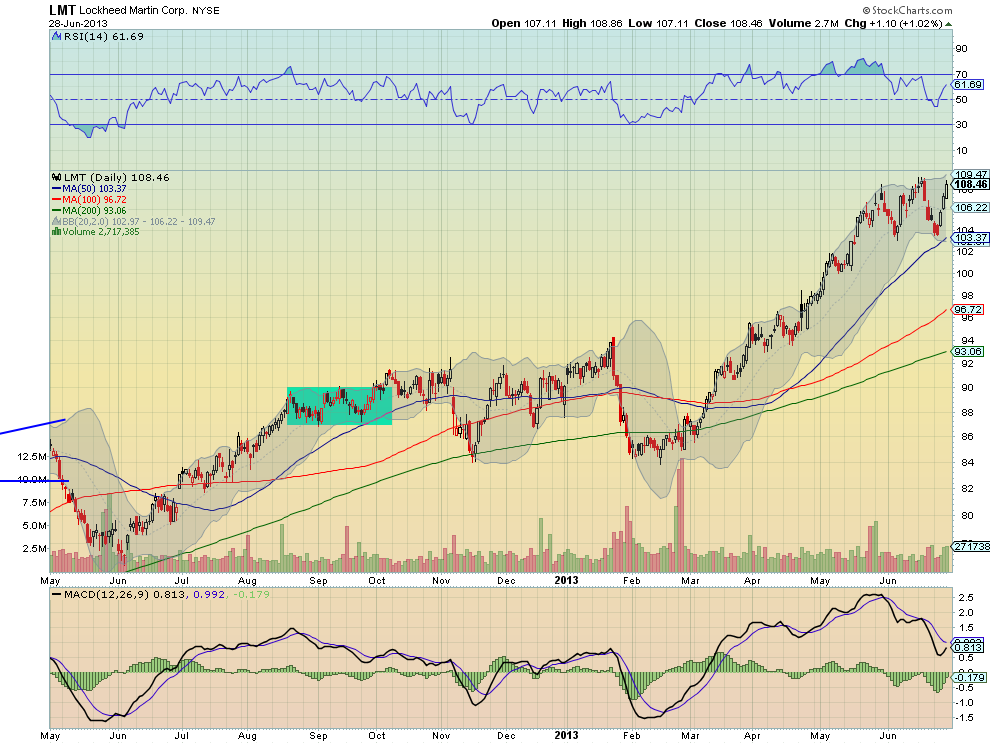
Lockheed Martin, LMT, is moving towards resistance after making a double bottom in consolidation. The move higher, a 3 Advancing White Soldiers pattern, is bullish and it has support for more upside from a bullish and rising RSI and a MACD that is turning up and about to cross positive.
Northern Trust, Ticker: NTRS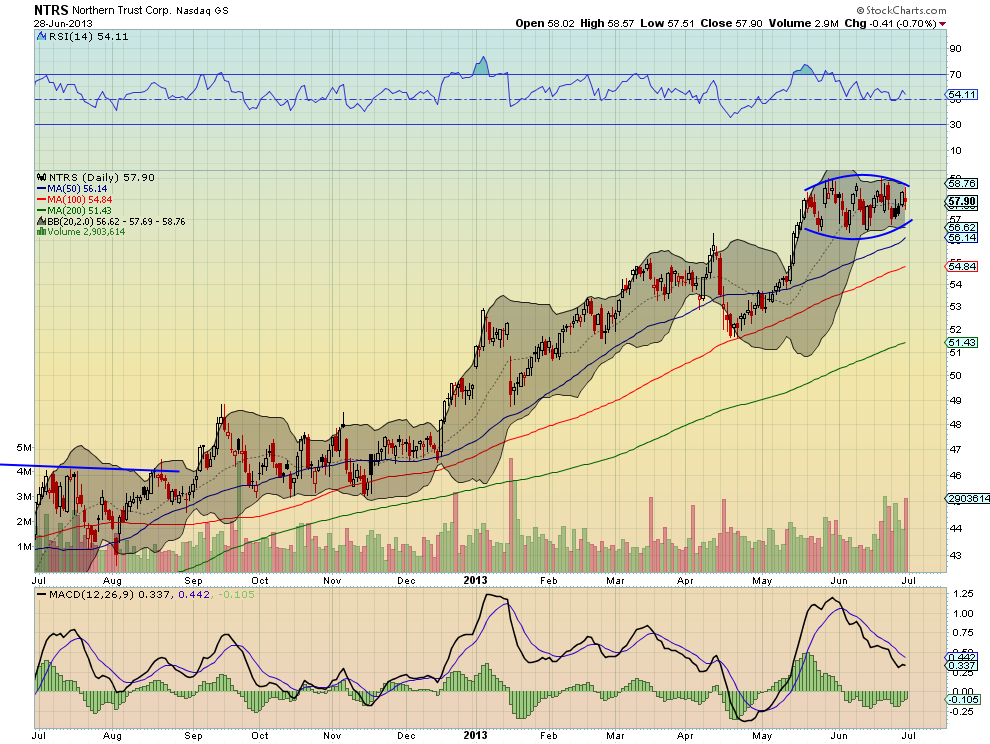
Northern Trust, NTRS, is consolidating in a rounded Diamond pattern after a move up off of the 100 SMA in April. The RSI is holding in bullish territory with a MACD that has pulled back substantially and flattening, for what may be a turn back higher.
Tractor Supply, Ticker: TSCO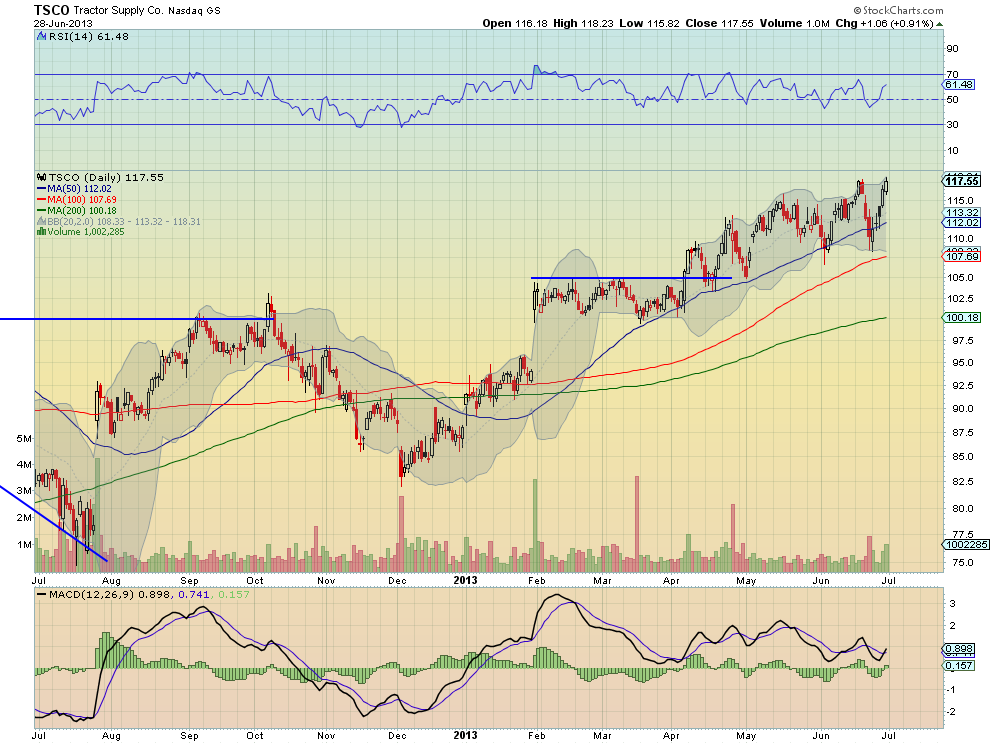
Tractor Supply, TSCO, is at resistance and moving higher as the RSI and MACD both support further upside price action. It is now making its 5th higher high after breaking consolidation in April, retesting and holding, with the Bollinger bands opening higher.
Valeant Pharmaceuticals, Ticker: VRX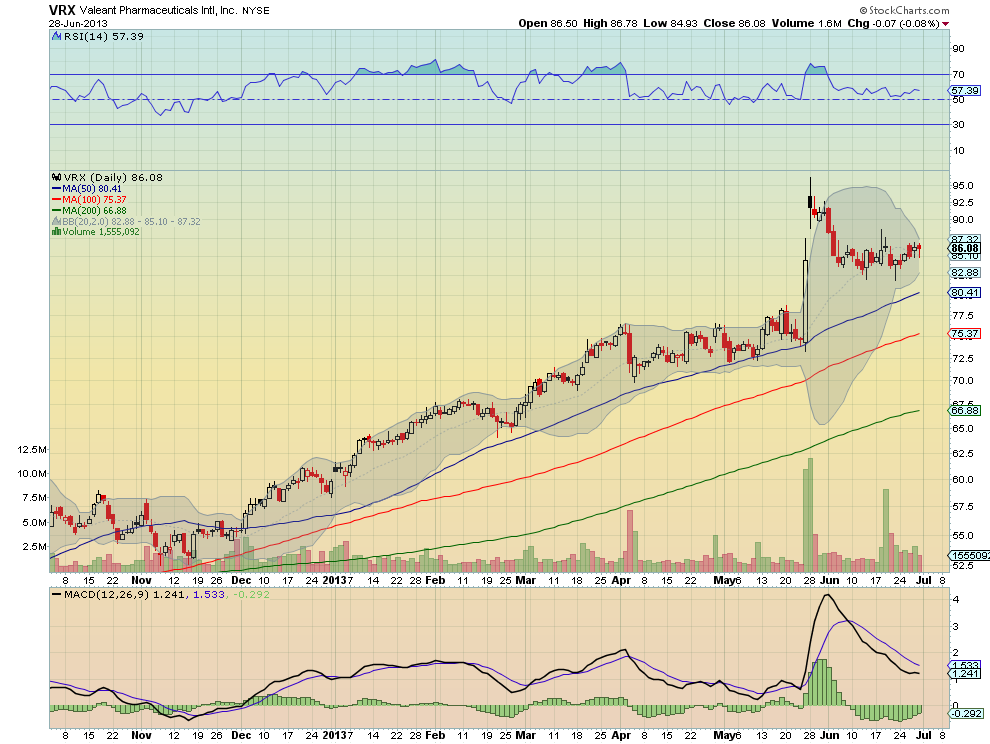
Valeant Pharmaceuticals, VRX, is trying to move higher out of a bull flag. The RSI has remained bullish throughout the pullback and the MACD is flattening. With the Bollinger bands squeezing a move is likely very soon.
After reviewing over 1,000 charts, I have found some good setups for the week. These were selected and should be viewed in the context of the broad Market Macro picture reviewed Saturday which, heading into the Holiday shortened week sees the Equity markets look tired in their bounce. Look for Gold to consolidate or bounce in its downtrend while Crude Oil is biased higher in the consolidation. The US Dollar Index looks strong and ready to continue higher while US Treasuries may continue their bounce in the downtrend. The Shanghai Composite and Emerging Markets both look to bounce in their downtrends. Volatility looks to remain subdued but drifting higher keeping the bias lower for the equity index ETF’s SPY, IWM and QQQ. Their charts all look to be tired in upward move within their intermediate downtrends in the long term uptrend. Use this information as you prepare for the coming week and trad’em well.
Disclaimer: The information in this blog post represents my own opinions and does not contain a recommendation for any particular security or investment. I or my affiliates may hold positions or other interests in securities mentioned in the Blog, please see my Disclaimer page for my full disclaimer.
Original post
- English (UK)
- English (India)
- English (Canada)
- English (Australia)
- English (South Africa)
- English (Philippines)
- English (Nigeria)
- Deutsch
- Español (España)
- Español (México)
- Français
- Italiano
- Nederlands
- Português (Portugal)
- Polski
- Português (Brasil)
- Русский
- Türkçe
- العربية
- Ελληνικά
- Svenska
- Suomi
- עברית
- 日本語
- 한국어
- 简体中文
- 繁體中文
- Bahasa Indonesia
- Bahasa Melayu
- ไทย
- Tiếng Việt
- हिंदी
Top Trade Ideas For The Week: Nordstrom, Lockheed Martin, Tractor Supply
Published 07/01/2013, 01:39 AM
Updated 05/14/2017, 06:45 AM
Top Trade Ideas For The Week: Nordstrom, Lockheed Martin, Tractor Supply
3rd party Ad. Not an offer or recommendation by Investing.com. See disclosure here or
remove ads
.
Latest comments
Install Our App
Risk Disclosure: Trading in financial instruments and/or cryptocurrencies involves high risks including the risk of losing some, or all, of your investment amount, and may not be suitable for all investors. Prices of cryptocurrencies are extremely volatile and may be affected by external factors such as financial, regulatory or political events. Trading on margin increases the financial risks.
Before deciding to trade in financial instrument or cryptocurrencies you should be fully informed of the risks and costs associated with trading the financial markets, carefully consider your investment objectives, level of experience, and risk appetite, and seek professional advice where needed.
Fusion Media would like to remind you that the data contained in this website is not necessarily real-time nor accurate. The data and prices on the website are not necessarily provided by any market or exchange, but may be provided by market makers, and so prices may not be accurate and may differ from the actual price at any given market, meaning prices are indicative and not appropriate for trading purposes. Fusion Media and any provider of the data contained in this website will not accept liability for any loss or damage as a result of your trading, or your reliance on the information contained within this website.
It is prohibited to use, store, reproduce, display, modify, transmit or distribute the data contained in this website without the explicit prior written permission of Fusion Media and/or the data provider. All intellectual property rights are reserved by the providers and/or the exchange providing the data contained in this website.
Fusion Media may be compensated by the advertisers that appear on the website, based on your interaction with the advertisements or advertisers.
© 2007-2024 - Fusion Media Limited. All Rights Reserved.