ConAgra Foods Inc (NYSE:CAG)
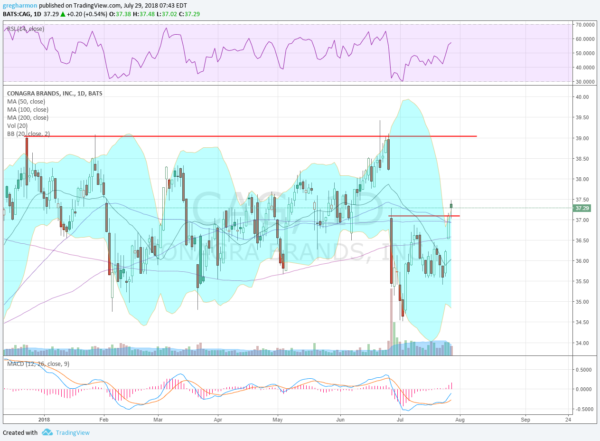
Conagra, CAG, gapped down in June and then continued to a low in July. It bounced from there, stalling just prior to reaching the gap area. It pulled back to a higher low and then reversed, ending last week with a move into the gap. The RSI is at the edge of the bullish zone with the MACD near a cross to positive. There is resistance at 37.75 and 38.30 then 39. Support lower comes at 37.10 and 36.60 then 35.60. Short interest is moderate at 4.8%. Enter long now (over 37.10) with a stop at 36.95. As it moves over 37.75 move the stop to break even and then to a 65 cent trailing stop over 38. Take off 1/3 on a stall at 39 or higher. As an options trade consider the August 37 Calls (offered at 75 cents late Friday) and trade them like the stock trade (using the stock price as a trigger, stop and target). Sell the August 35 Puts (10 cents) to lower the cost.
ConocoPhillips (NYSE:COP)
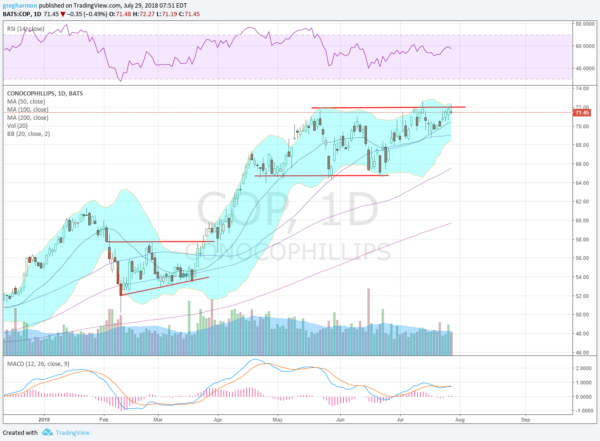
ConocoPhillips, COP, rose up out of consolidation in March, continuing to a top in May. It has consolidated in a sideways channel since. Two weeks ago it touched the top of consolidation and pulled back. This time it found support at a higher low and reversed back to resistance to end last week. The RSI is holding in the bullish zone with the MACD level and positive. There is resistance at 72.10 and 74 then 78.20 and 81.50 before 86.50. Support lower comes at 70.60 and 68.80 then 67.35 and 64.75. Short interest is low at 1.4%. Enter long on a move over 72.10 with a stop at 70.50. AS it moves over 73 move the stop to break even and then to a 95 cent trailing stop over 73.05. Let the stop take you out of the trade. As an options trade consider the August 72 Calls (1.40) and trade them like the stock trade. Sell the August 75 Calls (42 cents) to lower the cost.
M&T Bank (NYSE:MTB)
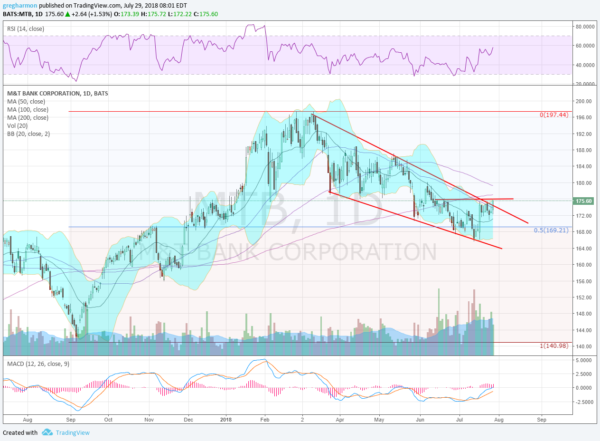
M&T Bank, MTB, rose from a bottom in September, topping out in February. It has been pulling back since then, retracing 50% of the move two weeks ago before a push higher. That took it to the top of a falling wedge and it consolidated. Last week that consolidation pushed through the wedge. The RSI is at the edge of the bullish zone with the MACD crossing to positive. There is resistance at 176 and 180 then 187.50 and 193 before 197.50. Support lower sits at 172.50 and 169.20 before 166.30. Short interest is low at 1.7%. Enter long on a move over 176 with a stop at 172. As it moves over 178 move the stop to break even and then to a 3.50 trailing stop over 179.50. Let the stop take you out of the trade. As an options trade consider the August 175 Calls (3.50) and trade them like the stock trade.
Perrigo Co (NYSE:PRGO)
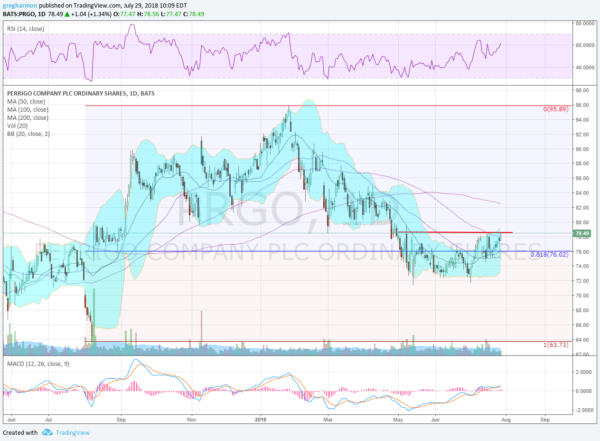
Perrigo, PRGO, gapped higher off of a low in August last year. It consolidated the initial for 3 weeks and then continued higher, eventually peaking in January. It pulled back from there, finding support after retracing a little more than 61.8% of the move higher. It has been consolidating there for nearly 3 months but recently started to move higher, crossing the 100 day SMA Friday. The RSI is rising and bullish with the MACD rising and positive. There is resistance at 78.75 then 80.50 and 83.20 before 84.50 and 86.80 then 90 and 95.90. Support lower comes at 77 and 75. Short interest is moderate at 4.6%. Enter long on a move over 78.75 with a stop at 77. As it moves over 79.50 move the stop to break even and then to a 1.75 trailing stop over 80.50. Let the stop take you out of the trade. As an options trade consider the August 3 Expiry 78.50 Calls (1.05) and trade them like the stock trade. The company is expected to report earnings on August 9th.
Signet Jewelers Ltd (NYSE:SIG)
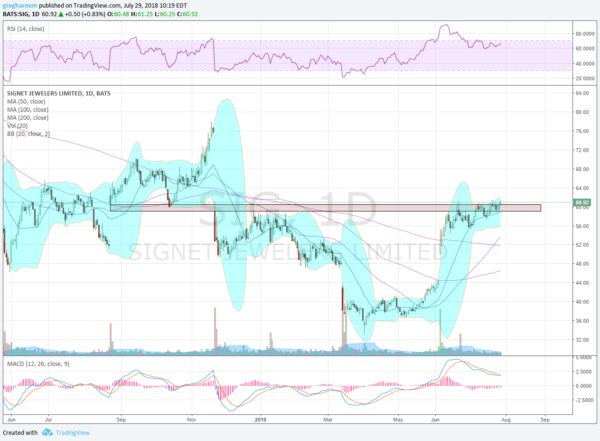
Signet Jewelers, SIG, gapped down in November and found support 2 days later. It bounced from there, to the gap level and reversed back lower. A second gap down in March found support and consolidated for 2 months before gapping to the upside in June. Now it is back at the first gap level acting as resistance and trying to push through to the upside. The RSI is in the bullish zone with the MACD reset lower but positive. There is resistance at 60.60 and 64.70 then 68 and 70 before 76.80. Support lower comes at 58.60 and 55.30 then 52.20 and 48. Short interest is high at 19.5%. Enter long on a move over 61.25 with a stop at 58.60. As it moves over 62.50 move the stop to break even and then to a 2 trailing stop over 63.25. Let the stop take you out of the trade. As an options trade consider the August 61 Calls (2.15) and trade them like the stock trade.
The information in this blog post represents my own opinions and does not contain a recommendation for any particular security or investment. I or my affiliates may hold positions or other interests in securities mentioned in the Blog, please see my Disclaimer page for my full disclaimer.
