Here are the Rest of the Top 10:
BlackRock Inc (NYSE:BLK)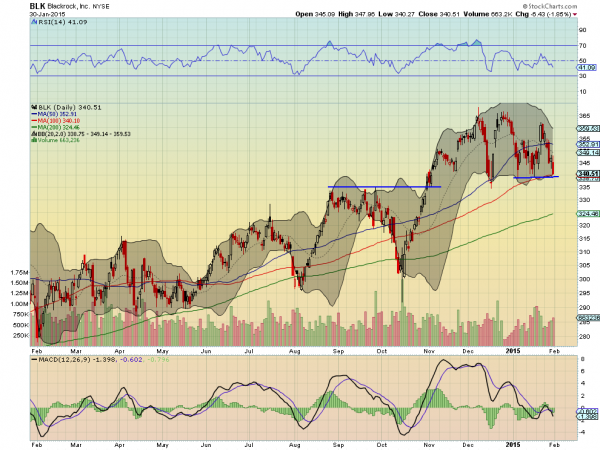
BlackRock, BLK, has been consolidating over support in a wide range since November. Recently there has been downside pressure that resulted in the price ending Friday at support and the 100 day SMA. The falling RSI and MACD would support a push lower.
Craft Brew Alliance Inc (NASDAQ:BREW)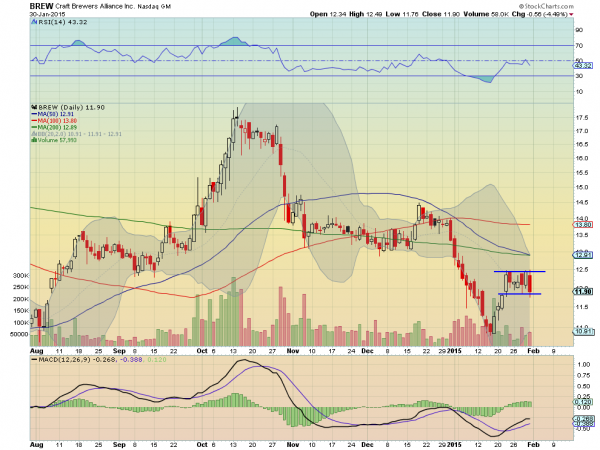
Craft Brew Alliance, BREW, moved lower throughout last fall in a two step fashion. Both steps were $3 moves. But since mid-January it has rebounded and is now consolidating. What two weeks ago looked like a Death Cross (50 day SMA crossing down through the 200 day SMA) is now turning into more of a glancing blow. The RSI is struggling to get over the mid line for now and the MACD may be leveling. Watch this for a break either way.
Interactive Brokers Group Inc (NASDAQ:IBKR)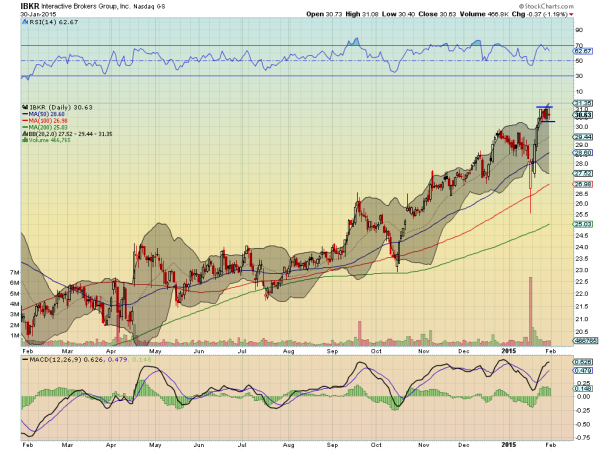
Interactive Brokers, IBKR, has been trending higher since September if you knock out the couple of days when FXCM scared the world about currency trading. Now it is consolidating at the highs. The RSI is in the bullish zone and the MACD is rising as it moves sideways back into the Bollinger Bands®.
Eli Lilly and Company (NYSE:LLY)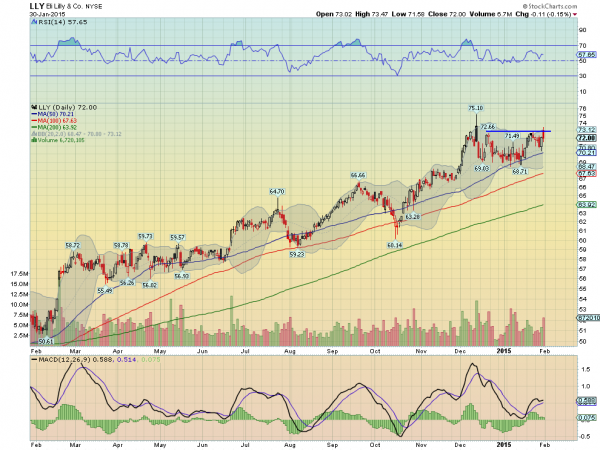
Eli Lilly, LLY, has been trending higher since moving out of consolidation in June. The last 2 months has been another consolidation range. And after connecting with the 50 day SMA it is now pressing against resistance. The RSI has held in the bullish zone while the MACD is rising, both supporting upward price movement.
Newfield Exploration Company (NYSE:NFX)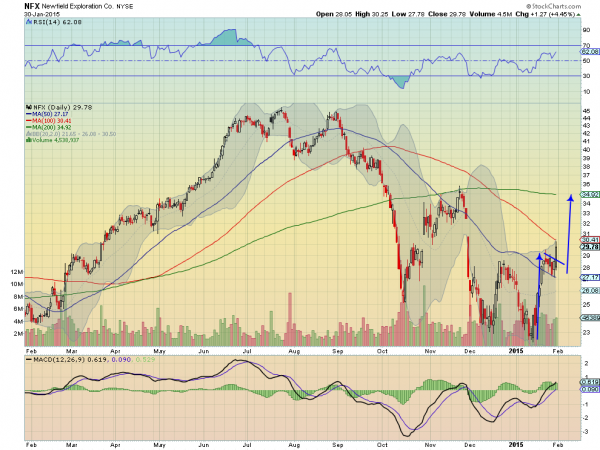
Newfield Exploration, NFX, fell from peak at 45 quickly to 25. After a quick bounce to the 200 day SMA it fell back and made a ‘W’. There was a quick consolidation last week before it started higher again Friday. The RSI is into the bullish zone now and making new higher highs as the MACD rising, supporting more upward price action.
Elsewhere look for Gold to continue to consolidate in the short term uptrend while Crude Oil may be ready for a bounce or reversal in the downtrend. The US Dollar Index seems ready to consolidate sideways in the uptrend while US Treasuries continue to be biased higher. The Shanghai Composite is also consolidating in its uptrend while Emerging Markets look to have failed in their attempt to rally and are biased to the downside.
Volatility looks to remain low but drifting up easing the wind behind the equity markets to a light breeze. The equity index ETF’s SPDR S&P 500 (ARCA:SPY), iShares Russell 2000 Index (ARCA:IWM) and PowerShares QQQ (NASDAQ:QQQ), all see risk to the downside in both the daily and weekly charts with the QQQ the strongest on the longer timeframe followed by the IWM and then the SPY, but the IWM possibly a bit stronger on the short timeframe over both the QQQ and SPY. Use this information as you prepare for the coming week and trad’em well.
Disclaimer: The information in this blog post represents my own opinions and does not contain a recommendation for any particular security or investment. I or my affiliates may hold positions or other interests in securities mentioned in the Blog, please see my Disclaimer page for my full disclaimer.
