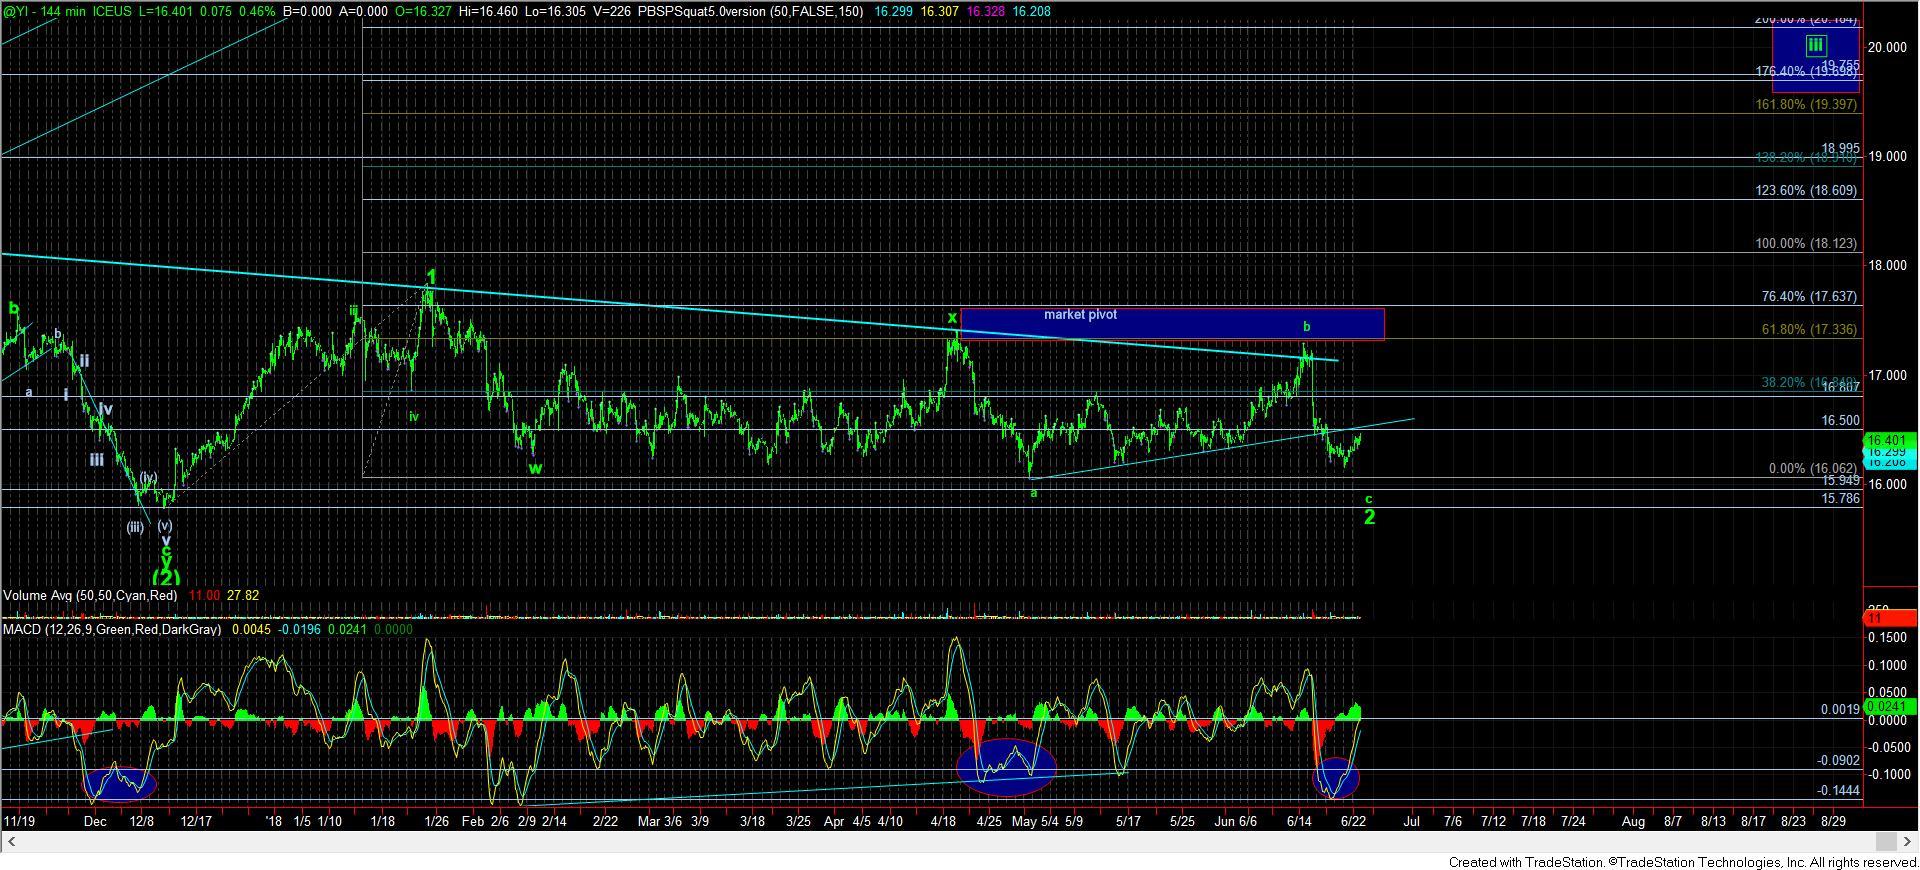
For those that follow me regularly, you will know that I have been tracking a set-up for the SPDR Gold Trust ETF which I analyze as a proxy for the gold market. I also believe that gold can outperform the general equity market once we confirm a long-term break out has begun, and I still think we can see it in occur in 2018. This week, I will provide an update to SPDR Gold Trust ETF (NYSE:GLD).
While I have gone on record as to why I do not think GLD ETF is a wise long-term investment hold, I still use it to track the market movements.
For the last year and a half, the metals complex has frustrated everyone who has invested in the complex with a sideways consolidation. Many have been certain that it is setting us up to break below $1,000 gold, and the voices for that have been getting louder and more numerous.
As I noted to the members of ElliottWaveTrader:
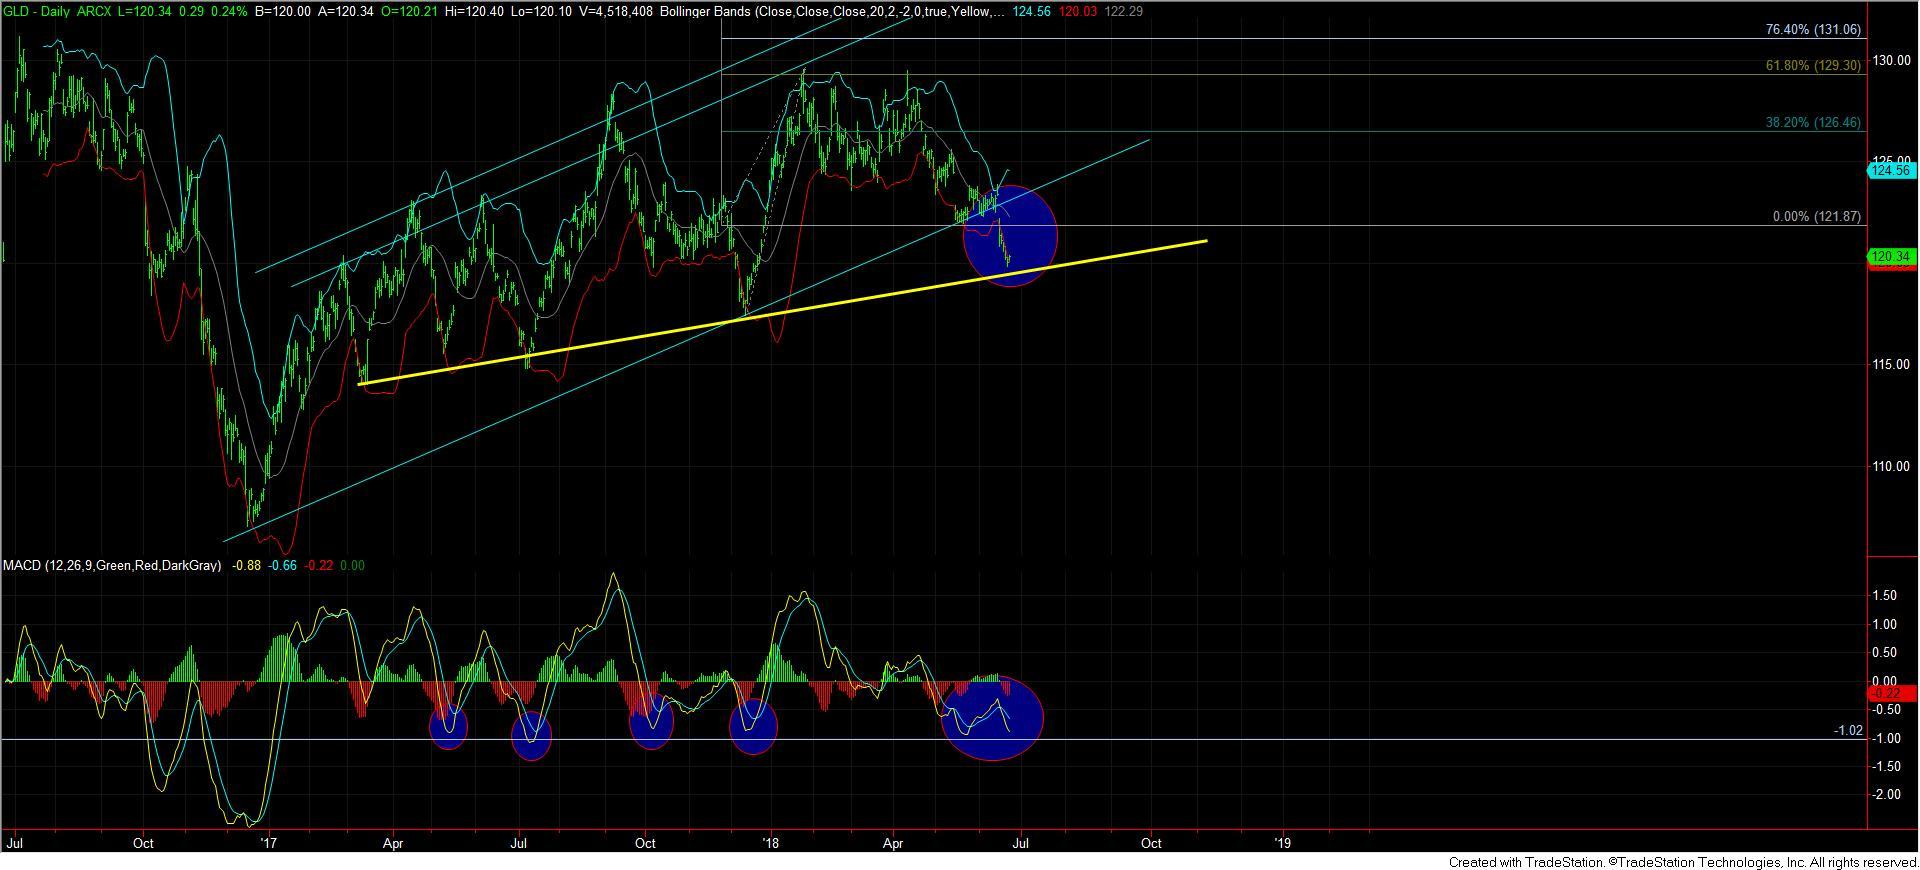
“Calls for sub $1,000 gold are being heard quite loudly. Many are “feeling” that the metals bear market has not ended. And, we have the usual suspects who have been terribly whipsawed in this market following trendline analysis highlighting the current trend line break down again. Isn’t this all too familiar to you already?
Each time this has happened over the last two years, the metals have staged a “surprising” rally to the upside. Yes, when the beach ball gets pushed too far down, it is bound to rise to the surface, and often with strong force. And, with this market only going sideways for well over a year, there does not seem to be many left who are looking higher in this market. But, that is how major rallies begin – when most are looking lower or are completely disinterested. Major rallies often begin with the fewest passengers aboard the train.
As I looked around the web on Friday, I felt quite lonely maintaining an expectation for an imminent bottom in the metals complex. While most of the market is totally disgusted with the lack of movement in the complex for the last year and a half, and whereas the great majority of the market seems quite bearish (other than the perma-bulls), it is hard to see how the market is going to accelerate lower from here. Rather, I think the signs are pointing to the market bottoming rather than heading to sub-$1000 gold, which many believe is imminent.”
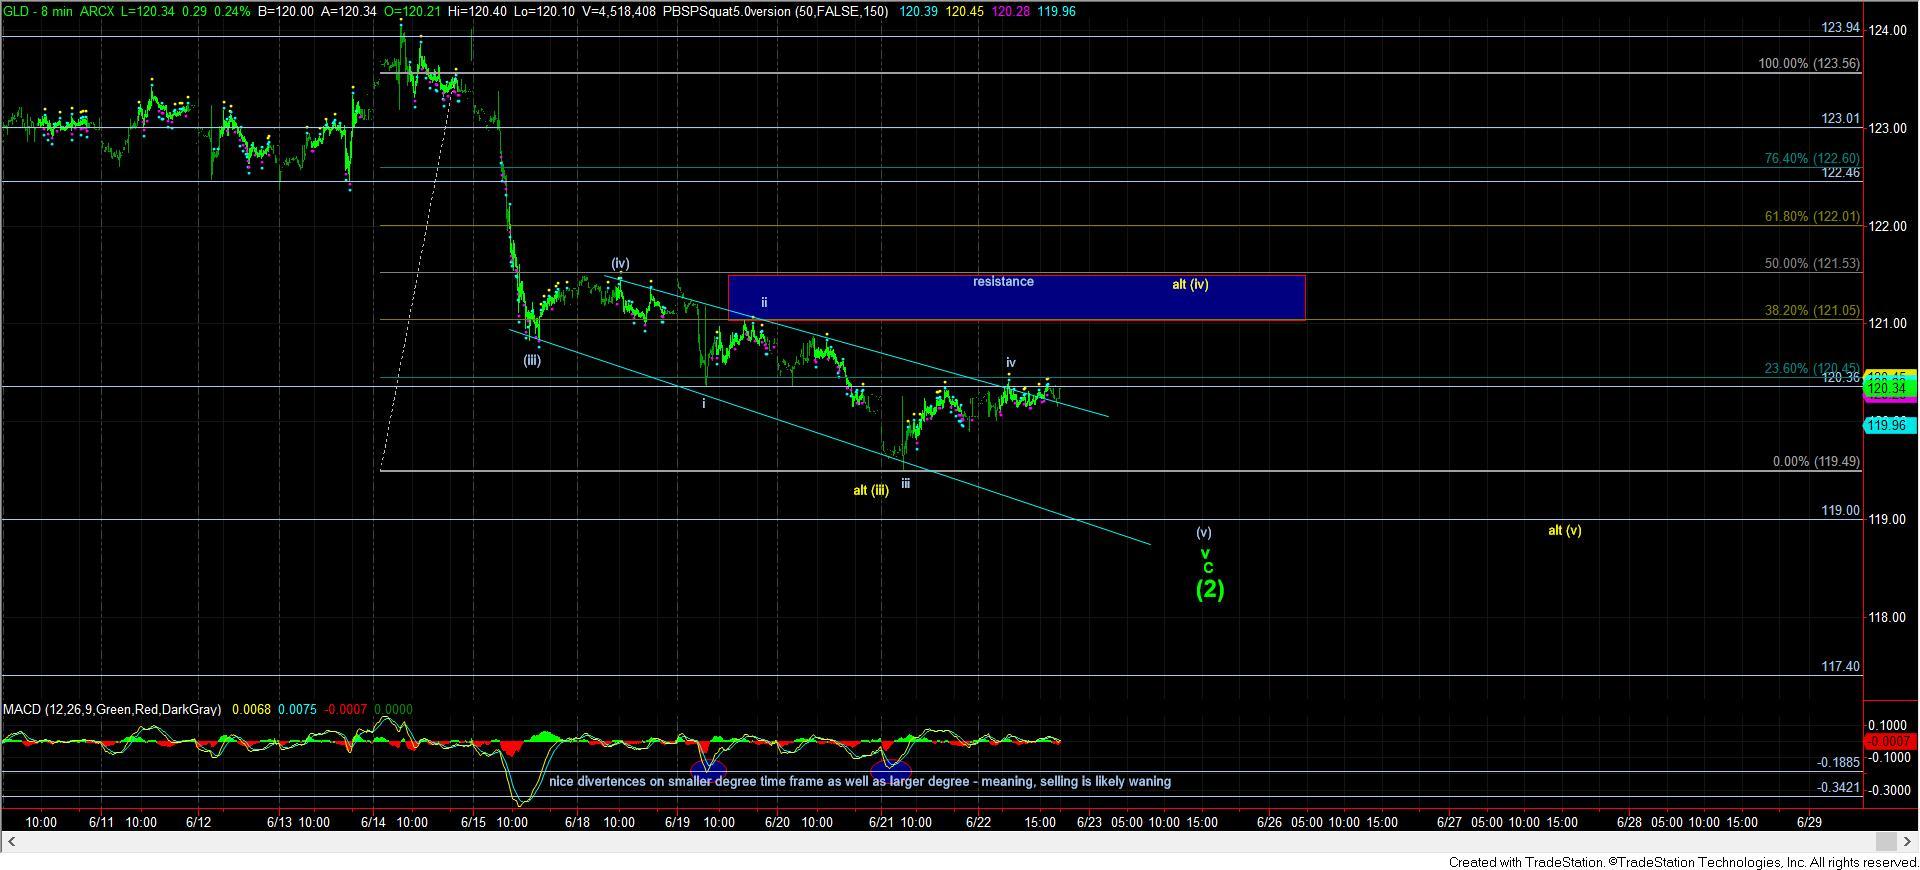
For the two weeks before the last downside was seen in the metals complex, I warned my members that we will likely test support in the complex, as the market had a short-term downside setup in place:
“At the end of the day, we still have immediate set ups, as noted above, which are pointing a bit lower in the complex . . . until the market takes out the noted resistance, we have to respect the micro set ups which are pointing a bit lower before the next rally takes hold.”
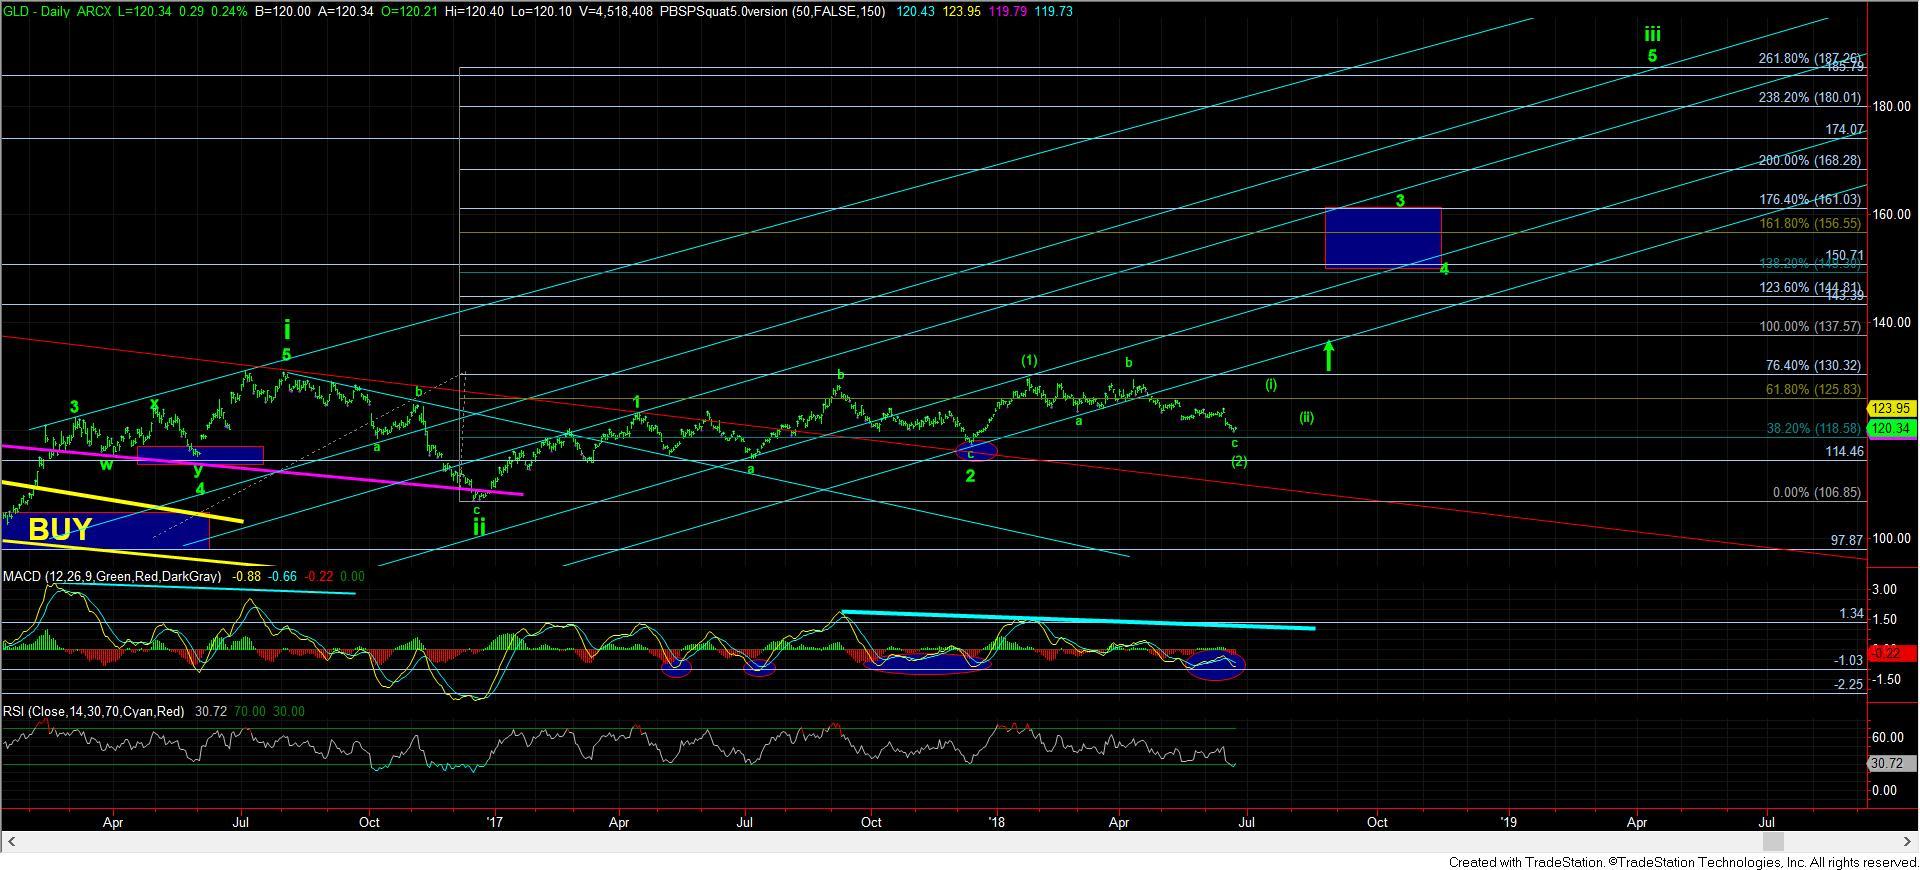
Currently, we have almost reached those support levels to which we were pointing weeks ago. For those that have read my metals analysis over the last few months, you would know that my perspective has been that, as long as GLD holds the 119 support region, we still have a very powerful rally setup in place. And, as long as GLD holds that 119 region as support, the market still retains a set-up to rally strongly towards the 150 region in 2018. It would take a break down below 117.40 to invalidate that immediate setup, but a sustained break down below 119 would begin to get me concerned.
And, since we deal in probabilities and not certainties when analyzing financial markets, we have to maintain an objective perspective to understand if the market will follow through on the setups we see, or if they will invalidate those setups. Many took me to task for being too bearish in the metals complex until the end of 2015. But, once the structure pointed to a major low being near, I turned quite bullish, and even rolled out the EWT Miners Portfolio in September 2015 as a new service to the members of my trading room, and began to buy mining stocks which looked to have bottomed. I think we all know how that turned out.
In fact, I wrote this in public articles at the end of 2015:
“As we move into 2016, I believe there is a greater than 80% probability that we finally see a long term bottom formed in the metals and miners and the long term bull market resumes. Those that followed our advice in 2011, and moved out of this market for the correction we expected, are now moving back into this market as we approach the long term bottom. In 2011, before gold even topped, we set our ideal target for this correction in the $700-$1,000 region in gold. We are now reaching our ideal target region, and the pattern we have developed over the last 4 years is just about complete. . . For those interested in my advice, I would highly suggest you start moving back into this market with your long term money . . .”
So, for me, it is all about what the market is telling me from an objective standpoint. Remember, we have been strongly, and correctly, bullish the stock market when many others have been quite bearish, especially in early 2016, when we were looking for a test of the 1800 region before we expected the market to rally to 2600+. And, that has served us quite well.
While I certainly could not foresee the complex moving sideways for almost two years (as I am only an analyst and not a prophet), at least for now I will have to retain a bullish bias of the GLD for as long as the 119 region holds as support. And, it looks like the next few weeks will tell us if the market will follow through on this pattern or not. Should we see such follow through, it will likely take most by surprise, as they have been lulled to sleep over the last two years by the price action in the complex. Yet, this is how markets seem to work.
The train often leaves the station with the fewest possible passengers aboard. And, then, as they say, the chase is on.
