Market Movers: Weekly Technical Outlook
Technical Developments to Watch:
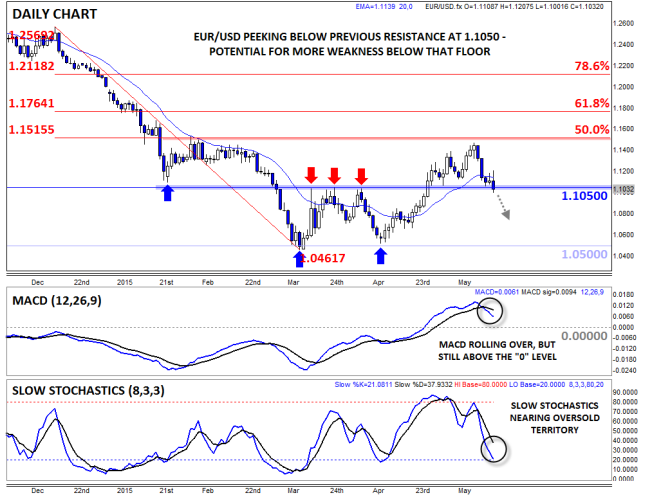
- EUR/USD peeking below major support at 1.1050
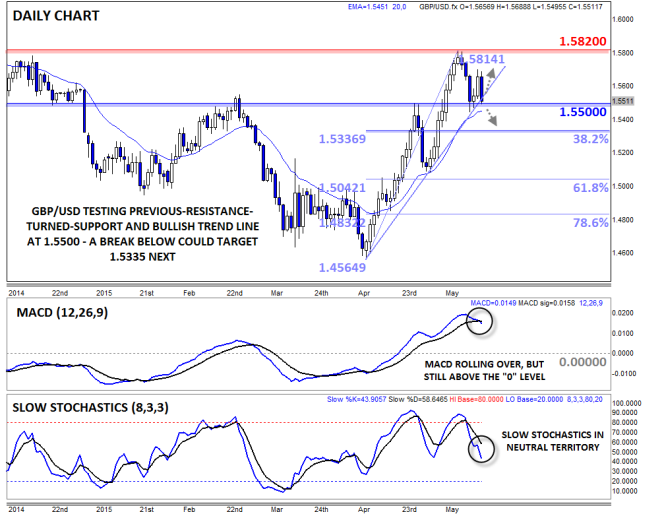
- GBP/USD testing support at 1.5500
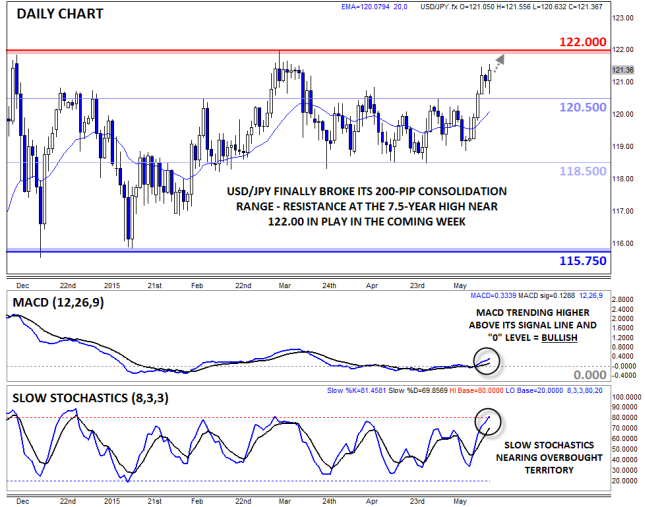
- USD/JPY breaking out, 7.5-year high at 122.00 in sight
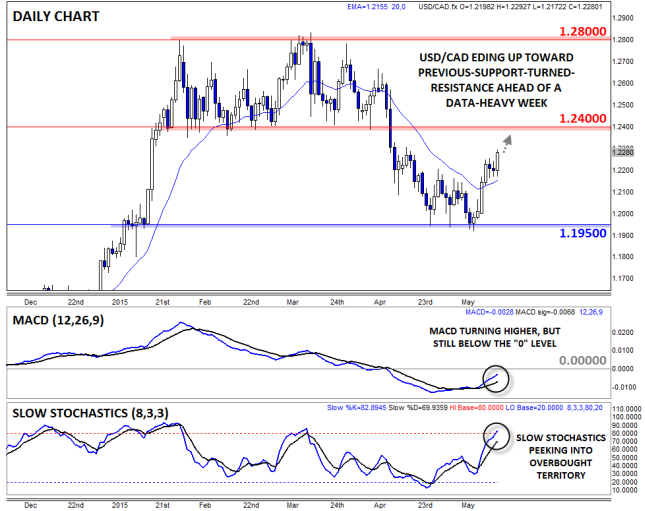
- USD/CAD in play, with key resistance at 1.2400 and support down around 1.1950-1.2000

* Bias determined by the relationship between price and various EMAs. The following hierarchy determines bias (numbers represent how many EMAs the price closed the week above): 0 – Strongly Bearish, 1 – Slightly Bearish, 2 – Neutral, 3 – Slightly Bullish, 4 – Strongly Bullish.
** All data and comments in this report as of Friday’s European session close **
EUR/USD

- EUR/USD fell sharply throughout last week to test 1.1050 support
- MACD rolling over, Slow Stochastics recently showed a triple bearish divergence
- The 1.1050 level is the key bull/bear line to watch this week
EUR/USD fell sharply over the course of last week, hurt by fears about Greece’s debt situation, continued weak economic data from the Eurozone, and a strong US Core CPI report on Friday. As of writing, the pair is testing major previous-resistance-turned-support at 1.1050; this level will be a critical level to watch for this week, with a confirmed break below suggesting that the year-long dollar uptrend may be resuming after the Q2 pullback. Meanwhile, the MACD indicator has rolled over and is now below its signal line, while the Slow Stochastics formed a clear triple bearish divergence at the recent highs, suggesting that 1.1470 may mark a major medium-term top. For this week, 1.1050 will be the bull/bear line in the sand, with the bias favoring the sellers beneath that floor.
Source: FOREX.com
GBP/USD

- GBP/USD bounced off converging support at 1.5500, but turned sharply lower on Friday
- MACD now moving sideways, in line with its signal line
- Bounce favored, but break below 1.5500 could expose 1.5335 next
GBP/USD bounced off previous-resistance-turned-support and its bullish trend line near 1.5500 midway through last week, but the pair reversed sharply lower on Friday to close near that critical level once again. The late reversal caused the MACD to flat-line near its signal line, foreshadowing a possible reversal of the recent bullish momentum. A bounce off 1.5500 support is favored early this week, but if the 1.5500 level gives way, a move down to the 38.2% Fibonacci retracement at 1.5335 could emerge.
USD/JPY

- USD/JPY finally rallied out of the tight 118.50-120.50 trading range last week
- MACD turning higher, signaling a possible move toward bullish momentum
- Potential for a continuation up to the 7.5-year high at 122.00 as long as rates hold above 120.50
USD/JPY finally saw some meaningful volatility last week, with bulls pushing the pair through previous resistance at 120.50 up into the mid-121.00s. After such a long consolidation, last week’s breakout could carry over into this week’s trade, with a potential move up to the 7.5-year high at 122.00 in play. The MACD has turned meaningfully in favor the bulls for the first time in months, though the Slow Stochastics indicator is now overbought, suggesting that we could see a pause if and when the 122.00 barrier is reached.
USD/CAD

- USD/CAD rallied on oil’s fall last week
- MACD turning higher, but still below the “0” level
- Clear range established between support in the 1.1950-1.2000 zone and resistance at 1.2400
USD/CAD is our currency pair in play this week due to a number of high-impact economic reports out of the US and Canada (see “Data Highlights” below for more). Last week, USD/CAD bounced from its well-established 1.1950-1.2000 support zone, reaching nearly 1.2300 as of writing on Friday afternoon. The pair’s MACD indicator has turned higher, but is still below the “0” level, showing fading bearish momentum. At the same time, the Slow Stochastics is now in overbought territory above 80. For this week, the pair could continue to consolidate in the broad 1.20-1.24 range, though a breakout in either direction would suggest a 200+ pip continuation in the same direction.
Can EUR/USD Hold its Ground above 1.10?
We’re almost halfway into 2015 and EUR/USD is nowhere near parity, despite the introduction of QE in Europe, the threat of a Grexit and the prospect of tighter interest rates in the US. The fact is that the aforementioned factors haven’t had as a dramatic an impact on the currency market as was expected, largely because traders got ahead of themselves when factoring the prospect of QE in Europe and adjudicating the economic recovery in the US into EUR/USD. Things simply didn’t go as planned, thus EUR/USD has been readjusting to better reflect the new global dynamic which has pushed the pair back above 1.1000.
In Europe, the announcement of the ECB’s QE program failed to weaken the euro significantly, as was envisioned before QE began. There are two overriding regional issues that are helping to support the common currency, with the first being an improvement in the outlook for the Eurozone due to a general enhancement of European economic data. The second reason, which isn’t mutually exclusive from Europe’s improving economic data, is a recovery in both core and peripheral European bond yields (excluding Greece), despite the ECB’s QE bond-buying program. This is largely the result of improving European economic data, the market’s lack of concern about the threat of contagion from the Greek situation and a dry core-EUR bond market (the ECB is buying bonds while Berlin maintains its fiscal prudence).
The improvement in European bond yields has pushed the US-German yield spread lower, after it peaked at around 1.9 earlier this year. As well as the aforementioned positive developments from Europe yields, a diminished likelihood of tighter monetary policy in the US due to soft US economic data has been helping to drive the US-German yield spread lower. This divergence of yields is a good thing for the euro and may continue to support the common currency if the spread tightens even further; recent tightening has helped EUR/USD brush off its brief venture below 1.0500 earlier in the year (see figure 1), with the pair looking more and more comfortable above 1.1000.
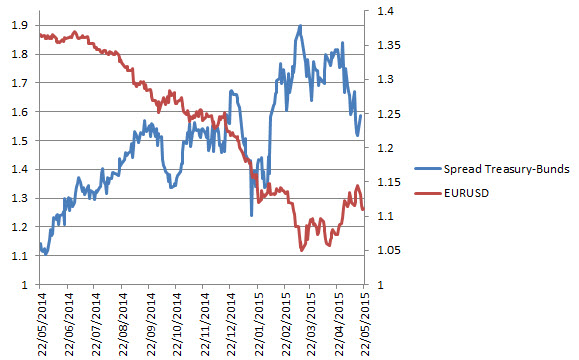
The biggest concern now for EUR/USD is that this improvement in European yields vs. US treasuries is reversed. This reversal could come from both sides of the spread and could spark another significant sell-off in EUR/USD. In the Eurozone, the fear is that these green shoots will wither and die, leaving the economy exposed and increasing the likelihood that the ECB will ramp up its QE program (it’s worth noting that a stronger euro could strangle any attempted economic recovery in Europe). The possibly of a Grexit increases every day that a deal cannot be agreed upon, especially with some big repayments falling due soon. On the other side of the equation, if the US economic recovery begins to gather momentum outside of the labor market (Friday’s strong Core CPI report is a move in the right direction on this front), it may support both Treasury yields and the US dollar as the Fed pursues a more hawkish stance.
What do the techs say?
From a technical perspective, EUR/USD is looking somewhat weak. As Matt Weller stated last week, the pair was rejected by its long-term bearish trend line, there’s a bearish crossover in daily MACD and consistent bearish divergence in daily slow stochastics. This suggests that EUR/USD may break below an important support zone around 1.1050 which would, in turn, confirm a bearish head-and-shoulders pattern. However, above 1.1050 we see the pair making another run at 1.1200, a break of which may see EUR/USD retest its long-term bearish trend line.
Look Ahead: Stocks
On Friday morning when this report was written, the S&P 500 was on course to finish higher for a third straight week after climbing to a fresh record high on Tuesday. Generally speaking, it has been slow progress amid the lack of any major fundamental drivers. On the one hand, the continued weakness in US data points to subdued growth in Q2, while on the other hand it means interest rates will remain low for longer. It is not just in the US where stocks are bolstered by historically low interest rates and some enormous programs of asset purchases, but in Japan and China and across Europe, too. Thus, with low rates across the major developed economies and because of the lack of any real alternatives, funds continue to find their way into higher-yielding stocks. The Federal Reserve is almost certainly not going to raise interest rates in June, although September now looks more likely after core CPI rose to a two-year high in April. In Europe, the ECB has said it will temporarily boost its asset purchases program. As such, we remain fundamentally bullish on equities.
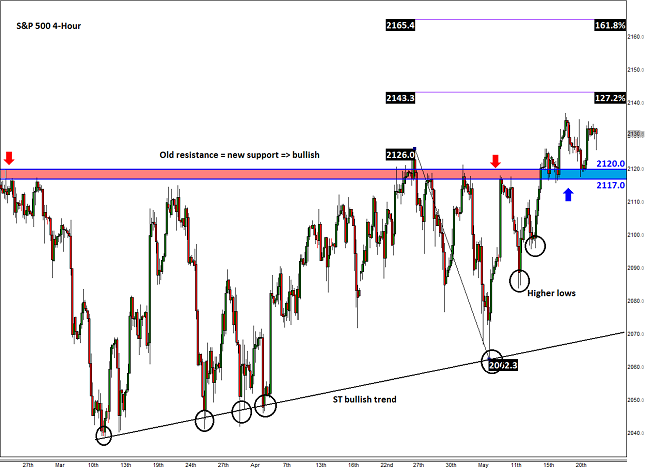
Next week could be a quieter one because of the smaller number of high-impact economic data and the fact that Monday will be a bank holiday in many countries. Nevertheless, the technical outlook remains bullish for US stocks. In one of our reports on the S&P 500, in mid-May, we pointed out that the benchmark US index was trying to break out of a lengthy consolidation pattern as it attempted to take out sturdy resistance around 2120 (see “Stocks: can S&P 500 finally clear 2120?” for more). In that report, we pointed out the fact that the bears had been reluctant to increase their positions meaningfully when a key support level had been broken. That pattern in our view was, and still is, bullish. What’s more, the index was making a series of higher lows in what essentially had been a messy bull-bear battle. We argued that if it S&P did eventually break higher, the next move could potentially be explosive due to the significant amount of time it had spent in consolidation. Undoubtedly some bullish speculators had also been waiting on the side lines until the trend became clearer. Now, as can be seen on the updated 4-hour chart below, the S&P did, as we had expected, break higher. But the first bounce off of the resistance-turned-support area of 2117-2120 came to a halt around 2137, which represented a less-than-1% gain. This was admittedly much less “explosive” than we had envisaged. Nevertheless, the index again found some solid support around this area this week and so it could still be on course to potentially rally to much higher levels in the next and subsequent weeks. However, if the index breaks back below the 2117-2120 area on a daily closing basis, then all bets are off and a sharp move lower could result as the bulls rush for the exits.
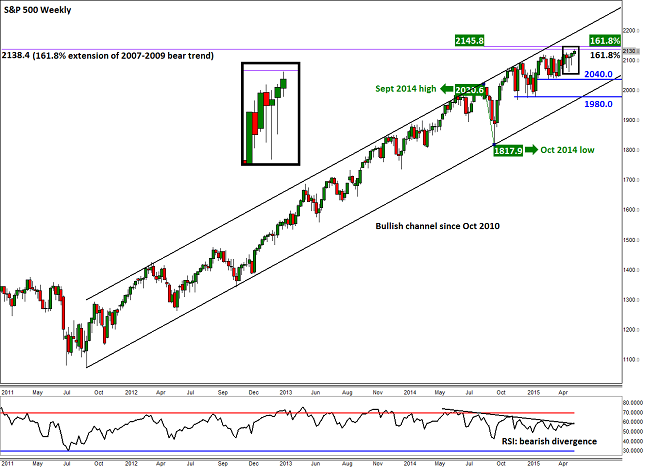
As the S&P is trading near the record high it had achieved earlier in the week, there are not much, if any, prior price reference points to watch for signs of resistance – apart from the all-time high itself at 2137. But there are a few Fibonacci extension levels that need some attention which are now not too far off. On the 4-hour chart, these are at 2143 and 2165, levels that correspond with the 127.2 and 161.8 per cent Fibonacci extensions of the last notable downswing (i.e. from 2126 in April to 2162 in May). But looking at the more significant weekly time frame, one can see that the 161.8% Fibonacci extension level of the entire 2007-09 crash is now looming large at 2138/9. Slightly ahead of this potentially exhaustion point is the 161.8% extension of another, albeit shorter term, price swing at 2145/6. The latter is derived from the downward swing between September and October 2014.
But despite the fact that these potential exhaustion levels are approaching, the underlying price action looks bullish with the S&P’s weekly chart, for example, showing a couple of hammer candles in as many weeks. What’s more, the recent breakout from the multi-month tight consolidation pattern ahead of these levels suggests the index was probably gearing up for a potentially sharp rally. Thus, we wouldn’t be surprised if the Fibonacci extension levels are taken out with relative ease. Indeed, most traders are probably (or should be) using these Fibonacci levels in this strong bullish trend as their long profit targets rather than short entry points. We think that the key resistance level will be around the resistance trend of the long-term bullish channel, which, depending on the speed of the potential rally, comes in all the way around 2200. In short, the trend remains your friend.
Look Ahead: Commodities
Crude oil prices pulled back a touch on Friday, seemingly on profit-taking ahead of the long weekend and on the back of a sharper-than-expected rise in US core CPI which underpinned the dollar and in turn undermined buck-denominated commodities across the board. This followed sharp gains on Thursday and a smaller rally the day before which was inspired by news of a third drawdown in US oil inventories in as many weeks. Crude’s rally on Thursday was also supported by a retreating dollar. The US currency erased some of the gains it had made earlier in the week on the back of further weakness in macroeconomic data. This time it was the latest unemployment claims, manufacturing PMI, Philly Fed manufacturing index and existing home sales figures that dented its rally. But as mentioned, the dollar bounced back on Friday and hurt oil and other commodity prices.
The dollar may play a big part in oil’s direction next week again, so it is vital to watch the economic calendar closely (see the “Global Data Highlights” section, below, for more). But the key data may well be the weekly oil inventories report, which will be released a day later than usual – on Thursday, rather than Wednesday – due to the bank holiday on Monday. As mentioned, crude stocks have now fallen for a third consecutive week, by a total of 8.8 million barrels. Stocks of crude products such as gasoline have also fallen as the US driving season kicks into a higher gear. But despite this “good” news, WTI has actually failed to print a new high since hitting $62.55 on May 6 i.e. the same day when news of the first crude stocks decline since the start of the year was reported. Evidently, some sort of destocking was already priced in. It will be interesting to see how oil will react to this week’s supply data, especially if it shows another sharp decline. But it is not all about US oil inventories. Although crude output here is expected to drop back slightly this year, the OPEC continues to produce more oil than is needed as it seeks to defend its market share. So, the supply glut is here to stay and is merely shifting from one region to another. This will likely keep oil prices under pressure for the foreseeable future, even if they manage to rise a little further in the near term.
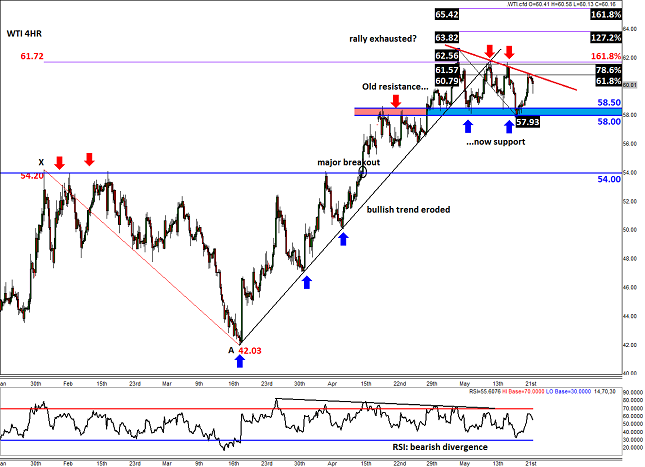
WTI’s next move will also depend at least partially on the direction of its eventual breakout from the consolidation pattern that it has been stuck in between $58.00 and $61.70. The lower end of this range is a resistance-turned-support level and is where oil bounced from on Wednesday. This probably caused traders who had sold after the breakdown of the bullish trend line to take profit on their bearish positions. But now that US oil has reached the technically-important 61.8% Fibonacci retracement level of the most recent downswing at $60.80, another downward move from here would not surprise us. But for oil to make a decisive move lower, the bears would need to see oil trade below the aforementioned $58.00 support area soon. If seen, oil could then easily drop all the way to $54.00 as there are not much further immediate supports ahead of this old resistance level. Meanwhile if WTI takes out the Fibonacci resistance level then it may make a move back towards the upper end of the range at $61.70 (which is also the 161.8% extension level of the last major downswing we saw between February and March). Beyond this level, the extension levels of the most recent downswing would become relevant at $63.80 (127.2%) and then $65.40 (161.8%).
You can see part 2 here.
