Sometimes the weekly calendar does not provide much fresh data. This has no effect on the need for content on the part of financial media. Blank pages and air time must be filled.
The result? A bull market in opinion --- data not required.
The economic data have been pretty consistent – low inflation, consistent but weak growth, and some bright spots, especially in housing.
The policy implications have also been clear – a Fed determined to emphasize the employment side of the dual mandate.
None of this provides much zest, especially since there is little change in the story. The way to spice it up is to find some extreme opinions and get an argument going. My prediction is that this week will see a more varied media lineup, with riffs on the following themes:
- New market top. Has the move been too fast, too far? Is it justified?
- Stagflation. I resisted putting this in the title. I notice that it is popular with readers, so the topic is a Twinkie-style sugar high. The story comes in two parts:
- Some will emphasize the "Stag" with another recession salvo from the gang at the ECRI. While the measures keep changing, they seem to command media attention. Too bad that the recession truth squad does not get equal time.
- Some will emphasize the "flation" by claiming that government data are wrong.
- Fed Manipulation. Yet another group will explain that this is a "training wheels" rally based upon a "sugar high" and warning that it will all end badly.
And that is my prediction – a week of opinion fluff instead of real information.
As usual, I have some thoughts about how to navigate these waters, which I'll report in the conclusion. First, let us do our regular update of last week's news and data.
Background on "Weighing the Week Ahead"
There are many good lists of upcoming events. One source I especially like is the weekly post from the WSJ's Market Beat blog. There is a nice combination of data, speeches, and other events.
In contrast, I highlight a smaller group of events. My theme is an expert guess about what we will be watching on TV and reading in the mainstream media. It is a focus on what I think is important for my trading and client portfolios.
This is unlike my other articles where I develop a focused, logical argument with supporting data on a single theme. Here I am simply sharing my conclusions. Sometimes these are topics that I have already written about, and others are on my agenda. I am putting the news in context.
Readers often disagree with my conclusions. Do not be bashful. Join in and comment about what we should expect in the days ahead. This weekly piece emphasizes my opinions about what is really important and how to put the news in context. I have had great success with my approach, but feel free to disagree. That is what makes a market!
Last Week's Data
Each week I break down events into good and bad. Often there is "ugly" and on rare occasion something really good. My working definition of "good" has two components:
- The news is market-friendly. Our personal policy preferences are not relevant for this test. And especially -- no politics.
- It is better than expectations.
This was a pretty good week for the economic data and market news.
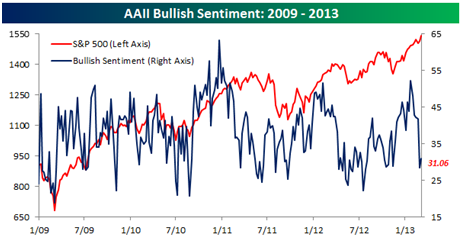
- Sentiment indicators have declined. This is bullish on a contrary basis. See Bespoke for a discussion of this chart – only a sample of their popular daily product.
- Household net worth hit a new high. I am scoring this as "good" but it was not a market moving event. (See the Doug Short take below).
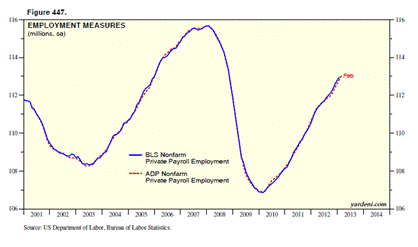
- Employment growth is good, especially in the wake of the "fiscal cliff." Remember the worry on this story? There were many effects at year-end, so it will take some sorting out. Dr. Ed Yardeni thinks that there was plenty of negativity built in at the end of the year. Despite the end of the payroll tax reduction, the overall impact is positive. So far he seems to be right. The market had a modest positive reaction to the news. (Some dissent in 'the bad' below).
- Obama meets GOP rank and file – away from the White House. Hey! It can't hurt. Even Leader Boehner seemed on board with the initiative. The President's poll ratings have been plunging, so that may provide some incentive to compromise.
- Gas Prices moved lower – but there is still a long way to go.
- The ISM Services Index hit a 12-month high. See Steven Hansen's story at GEI for the details. Take a look at the full table of sub-components and the comparison with the ISM manufacturing index.
The data for this week seemed pretty good on the surface, but there were issues if you took a deeper look.
Progress is inadequate, even as wealth rebounds. This is probably the single most important observation about the US economy. Doug Short's first-rate analysis of the net worth data, including all of the charts you would expect, shows why we still lag what is needed for solid economic improvement. There are many great charts, but this is my personal favorite. The growth has resumed, but we still lag the overall trend. 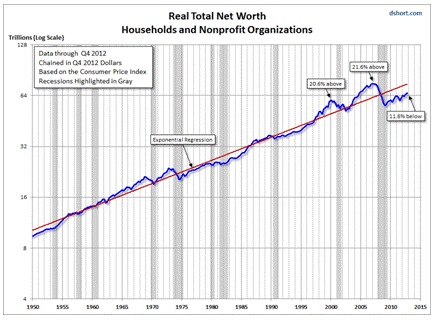
The Fed's biggest asset (surprise!) is student loans. Without going into many complex policy details, I suspect that most share my sense: This has a bad feeling to it. Doug Short has the data and a great chart. 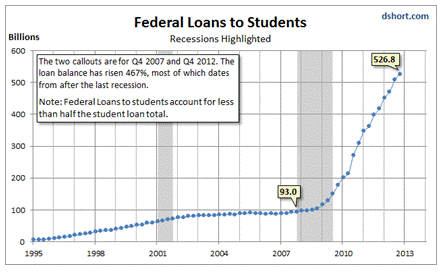
- The unemployment rate. The headline stated that unemployment was down by 0.2% percent. Most analysts know better. This headline number is a combination of the number employed and the size of the labor force. Even when employment is better, the labor force shrinkage has been a major factor in the employment rate calculation. Calculated Risk has a fine post discussing this topic, and including excellent charts. Here is an example:
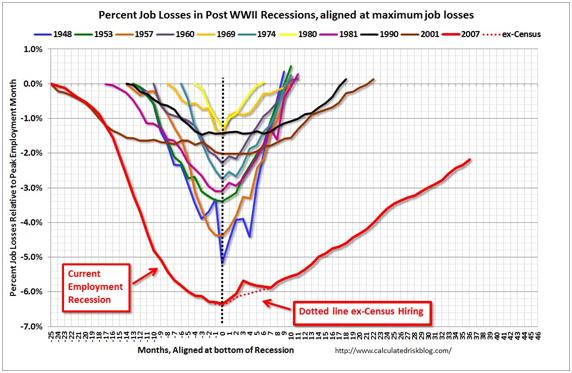
Bob Dieli's monthly employment report for his clients points out that the only true improvement in the unemployment rate over the last several months came last September. Other examples reflect changes in the labor force. (Check with Bob and mention us for a free sample).
Assorted Europe stories, mostly repeating the known economic weakness. I am taking note of this, but none of the market indicators suggest that this is really fresh news.
PE Ratios Edge Higher (via Bespoke). Most people will see this as a valuation negative, so that is where I have placed it. See the article for a helpful chart. Regular readers know that I expect the multiple to increase along with better confidence about the economy, so the interpretation is open to debate. See also Brian Gilmartin's tracking of forward earnings and the equity risk premium: "Assuming a 5% 10-year Treasury yield, the SP 500 would still need to increase 48% from its current level ($112.39 divided by 5%) to bring the SP 500 into parity."
The Ugly
The state of knowledge – for both traders and investors. Most market participants do not want to be confronted with reality, but you can do this in private. Here are two quizzes on important topics. Both involve the interpretation of data. I had a very low score on one of them and a very high score on the other. Feel free to report your own scores and observations in the comments.
- The ZH Test (via Cassandra at Ritholtz.com). I cannot improve on the introduction to the test, which everyone should take, if only for a laugh:
Just ask Zero-Hedge. Unfortunately, for wool-dyed pessimists and the other overly-skeptical black sheep of the thundering herd, it pays apocalyptic newsletter writers' paychecks, and Zero-Hedge/Tyler Durden's Manhattan bar tabs rather than those who permanently position against market priapism. And it's worse than zero-sum because those who are optimistically-challenged often pay for the bad advice – whether directly in subscriptions, inflated margins on retail bullion products, or indirectly via page-views and click-throughs AND then they get hosed by the market.
The first step to improving behaviour toxic to one's own self interest is admit one has a problem. As an aid to help those who have difficulty in distinguishing "a bearish trade" from "the lead boots of anger and pessimism", I've devised a little something I call the Zero-Hedge Test to determine more precisely whether readers objective realities are sufficiently paranoid, pessimistic, anti-social and rantingly angry to warrant more serious help."
- The labor force participation test. The WSJ's Real Time Economics Blog does a great job with this. They take a topic of great importance, cited by everyone, and illustrate why the basic understanding is rather poor. In a perfect world every pontificating pundit—everyone discussing labor force participation -- would have his score on this test reported along with his opinion. I invite readers to suggest their own disagreements with the BLS definitions – which seem fairly reasonable once you grasp the principles.
It is important to keep the current news in perspective. My weekly snapshot includes the most important summary indicators:
- The St. Louis Financial Stress Index.
- The key measures from our "Felix" ETF model.
- An updated analysis of recession probability.
The SLFSI reports with a one-week lag. This means that the reported values do not include last week's market action. The SLFSI has moved a lot lower, and is now out of the trigger range of my pre-determined risk alarm. This is an excellent tool for managing risk objectively, and it has suggested the need for more caution. Before implementing this indicator our team did extensive research, discovering a "warning range" that deserves respect. We identified a reading of 1.1 or higher as a place to consider reducing positions.
The SLFSI is not a market-timing tool, since it does not attempt to predict how people will interpret events. It uses data, mostly from credit markets, to reach an objective risk assessment. The biggest profits come from going all-in when risk is high on this indicator, but so do the biggest losses.
The C-Score is a weekly interpretation of the best recession indicator I found, Bob Dieli's "aggregate spread." I have now added a series of videos, where Dr. Dieli explains the rationale for his indicator and how it applied in each recession since the 50's. I have organized this so that you can pick a particular recession and see the discussion for that case. Those who are skeptics about the method should start by reviewing the video for that recession. Anyone who spends some time with this will learn a great deal about the history of recessions from a veteran observer.
I have promised another installment on how I use Bob's information to improve investing. I hope to have that soon. Anyone watching the videos will quickly learn that the aggregate spread (and the C Score) provides an early warning. Bob also has a collection of coincident indicators and is always questioning his own methods.
I also feature RecessionAlert, which combines a variety of different methods, including the ECRI, in developing a Super Index. They offer a free sample report. Anyone following them over the last year would have had useful and profitable guidance on the economy. Dwaine Van Vuuren also has an excellent data update, demonstrating how the coincident data have reduced recession prospects. Dwaine also notes that recession has struck in many countries around the world—monitoring many of the OECD countries here. Take a look!
Georg Vrba is a great "quant guy" with great credentials a variety of useful tools, some available via a free subscription. His take on a possible recession? Based upon unemployment data, the ECRI is wrong.
New Deal Democrat, writing at The Bonddad Blog, does an in-depth analysis of the latest ECRI story. The metrics change in a way that "cherry-picks" old data. Read the elusive story for yourself.
Doug Short has excellent continuing coverage of the ECRI recession prediction, now well over a year old. Doug updates all of the official indicators used by the NBER and also has a helpful list of articles about recession forecasting. His latest comment notes that the original ECRI call was basically a "bet against the Fed." At the time they claimed that there was nothing that anyone could do. Has their story changed? You really need to read Doug's article to get the full scope of the disparity in forecasts. Doug also continues to refresh the best chart update of the major indicators used by the NBER in recession dating.
Readers might also want to review my Recession Resource Page, which explains many of the concepts people get wrong. 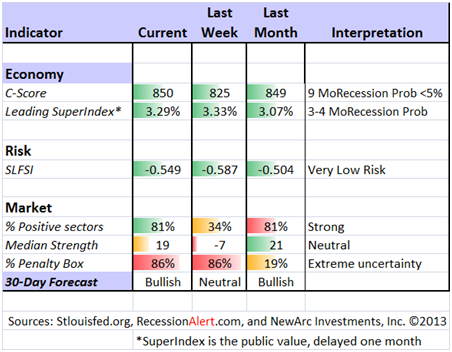
Our "Felix" model is the basis for our "official" vote in the weekly Ticker Sense Blogger Sentiment Poll. We have a long public record for these positions.
Recently we switched to a neutral position. These are one-month forecasts for the poll, but Felix has a three-week horizon. Felix's ratings have stabilized and improved significantly this week. The penalty box percentage measures our confidence in the forecast. A high rating means that most ETFs are in the penalty box, so we continue to have less confidence in the overall ratings. [For more on the penalty box see this article. For more on the system ratings, you can write to etf at newarc dot com for our free report package or to be added to the (free) weekly ETF email list. You can also write personally to me with questions or comments, and I'll do my best to answer.]
The Week Ahead
This week is rather light on important data.
The "A List" includes the following:
- Initial jobless claims (Th). Employment will continue as the focal point in evaluating the economy, and this is the most responsive indicator.
- Michigan Consumer Confidence (F). I treat this as more important than do others, mostly because our team's research shows it to be important. I see it mostly as a good confirming coincident indicator, important for consumer behavior and also for a read on employment.
The "B List" includes the following:
- Retail Sales (W). The data provide an important read on the consumer (somewhat redundant with private same store sales reports), especially given the end of the payroll tax relief and higher fuel prices.
- PPI (Th). Expectations are benign, making this report less interesting.
- CPI (F). See PPI.
- Industrial production (F). An important factor in the GDP/recession calculation.
- JOLTs Report (T). This report shows job turnover and actually provides a lot of data unknown to most. It does not get much attention, and when it does, the interpretation is soft. A good topic for a future story.
- Business inventories (W). Relevant for GDP revisions.
I am little interested in further revisions on elements of Q4 GDP, and the market will not be either. There are some retail earnings that might attract notice, but it is generally a quiet week. I also care little about regional Fed surveys.
Trading Time Frame
Felix has switched to a marginally bullish posture. It has made a slight difference in trading accounts. It has been a close call for several weeks. When the model turned to neutral, we dropped to 1/3 long. Since the sector was consumer staples, it was still a conservative call. We increased exposure this week in a second conservative sector. Felix has turned bullish, but it is like dipping a toe in the water.
Last week it looked like Felix might switch into an inverse ETF, but that now seems unlikely. Unlike human traders, Felix responds to data, not headlines. Felix also does not anticipate – requiring actual evidence for action.
Felix did pretty well last year, becoming more aggressive in a timely fashion, near the start of the summer rally, and getting out a couple of months ago. Since we only require three buyable sectors, the trading accounts look for the "bull market somewhere" even when the overall picture is neutral. Felix has been cautious, but still has caught most of the rally, and done so with less risk.
Investor Time Frame
Each week I think about the market from the perspective of different participants. The right move often depends upon your time frame and risk tolerance.
Buying in times of fear is easy to say, but so difficult to implement. Almost everyone I talk with wants to out-guess the market. The problem? Value is more readily determined than price! Individual investors too frequently try to imitate traders, guessing whether to be "all in" or "all out."
Warren Buffett spent a few hours on CNBC's Squawk Box last week. As regular readers know, I use TIVO and mute to find the best stories from this source. CNBC helped with some highlights – only nine well-spent minutes and you can see the best of the Buffett advice.
I was struck by this comment. Mr. Buffett said that the market offered you a quote on your holdings every day. This should be an advantage, but most people made poor use of it by trading at the wrong times. They would be better off to check on their portfolio every five years or so! It explains why most people make big mistakes in trying to time the market.
So do most "experts." I exposed the false claims of many pundits. You can check out the overall issue and also pundit ranks by reading The Seduction of Market Timing.
While there are no miracles available from market timing, you can definitely improve your risk/reward balance.
I strongly believe that active management can help investors. My concepts emphasize limiting risk and finding the right themes, not trying to time the markets via watching headlines. I really tried to pull this together in my 2013 preview for Seeking Alpha. This covers some key investor catalysts, as well as some specific stock and sector ideas. My recommendations did well last year, and we are off to another good start. You need to be comfortable in taking the other side of one of the most hated rallies in history.
But please beware! General ideas are not for everyone. Each person needs unique treatment. We have several different approaches, including one that emphasizes dividend stocks with enhanced yield from writing near-term call options.
We have collected some of our recent recommendations in a new investor resource page -- a starting point for the long-term investor. (Comments and suggestions welcome. I am trying to be helpful and I love feedback).
Final Thought
Whether you are a trader or an investor, you have done best to remain open-minded over the last four years. The warnings have not changed, but the facts have.
If you have not been reading and watching Downtown Josh Brown, you are missing out on some very frank and objective analysis.
Here is his take on the four-year anniversary of the market rally:
"Today, in case you've lost track, is the fourth anniversary of the March 9th "Generational Bottom" for the stock market. We are now headed into the fifth year of what many of us have been calling "The Impossible Rally" and I thought this would be a good time to recap and reflect.
Today, four years ago, the Dow Jones industrial average lost 80 points, or 1.2%, to end at 6,547.05, its lowest point since April 15, 1997. The S&P 500 index lost nearly 7 points or 1%, to end at 676.53, its lowest point since Sept. 12, 1996. The Nasdaq composite lost 25 points or 2%, to end at 1,268.64, its lowest point since Oct. 9, 2002.
That day, Merck (MRK) had announced a $41 billion acquisition of its rival drug maker Schering-Plough and the market didn't even blink. It had been going down so hard and for so long at that point that no one believed it would ever go up again.
That morning Roubini and Faber were out doing their typical Gloom and Doom show, scaring the wits out of anyone who would listen. One was talking about an intensifying recession with no way out, the other predicted the S&P would be dropping below 500 by year's end. The opposite ended up happening, of course." 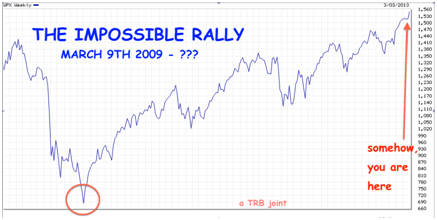
This is now in the past, of course, but the principle remains the same.
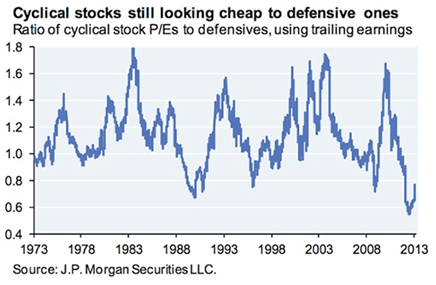
The Capital Observer notes that there are plenty of lagging stocks – mostly in cyclical and technology names. That is where I am buying as well. 