
Most potential stock investors have been bruised by events over the last decade. They are receptive to a message of fear, and many pundits are happy to satisfy their urges. Calling for a major market turn can be very profitable for the pundit. This is true even if the prediction is very early and the pundit never signals when to shift back.
With the stock market reaching new highs, there is no shortage of those eager to call the top.
Last Week Recap
Last week I suggested that earnings would dominate the story with some residual emphasis on the Fed. That was pretty accurate, but the pundit "top-calling" story began on Monday with Goldman's "stocks are richly valued" comment. While the losses were reversed later in the week, the theme continues.
This Week's Theme
The continuing attention to earnings reports will split attention this week with the ongoing debate over valuation and a potential bubble in stocks. Any earnings stumble will be portrayed as evidence.
There are several important themes:
- Stock prices are at valuations only seen at past market peaks. Mark Hulbert cites six ratios.
- Bubble Odds are modest, even using the Shiller CAPE. Gavyn Davies cites research putting the odds at 20-33%. Here is a key chart:

- Some methods see stocks as significantly undervalued. Jeremy Siegel sees another 10-15% just to reach fair value. Prices might not stop there because most investors are still not involved.
- Investors remain skeptical. Gallup surveys show that most people see this as a bad time to invest in stocks.
What should we make of this? To help us decide, we will have more earnings evidence this week.
As usual, I will provide some additional thoughts in the conclusion. I also have special emphasis on this topic in the Insight for Investors section. I have retooled this section to highlight fresh ideas each week while still providing links to continuing themes.
First, let us do our regular update of the last week's news and data. Readers, especially those new to this series, will benefit from reading the background information.

Last Week's Data
Each week I break down events into good and bad. Often there is "ugly" and on rare occasion something really good. My working definition of "good" has two components:
- The news is market-friendly. Our personal policy preferences are not relevant for this test. And especially -- no politics.
- It is better than expectations.
The Good
Some of the recent news was good.
- Bullish sentiment declined – a contrarian indicator. Here is the chart from Bespoke:

- Congress is reaching agreement on appropriations. I see progress in this. Stan Collender remains skeptical, seeing this as a one-time event.
- Earnings are less reliant on share buybacks. Not everyone was troubled by the buyback meme, but some wanted to see "real" earnings growth. This is a complicated story, covered very well by Cardiff Garcia. It deserves a careful reading.
- Inflation continues lower, perhaps influencing bond yields as well. It is not all about the taper. Izabella Kaminska has a thorough analysis, featuring this chart:

- Housing starts and building permits showed solid year-over-year gains, but the monthly change was a little soft. Calculated Risk sees the report as solid. I am following Bill McBride closely on this topic.
- Retail sales improved and beat expectations. Steven Hansen agrees, but is less than enthusiastic. The trading in retail stocks is also soft.
- Financial conditions are the best in two decades, analyze by Scott Grannis. This is consistent with my weekly reports on the SLFSI in the Quant Corner.
- The budget deficit decline continues. Scott Grannis analyzes the effects of economic growth, using several charts. This one is especially interesting:
The Bad
There was more bad news than we have recently seen.
Capitulation by the "hot money?" The National Association of Active Investment Managers uses survey data to reflect net long exposure. The Short Side of Long asks whether this means that everyone is on "one side of the boat.


- Forward Earnings trends, overall and by sector, are a little "wobbly" according to earnings guru Brian Gilmartin. While the recent changes are still in normal ranges, he describes various thoughtful concerns in his most recent post. I watch Brian's earnings news very closely.
- The earnings beat rate is disappointing (via Paul Vigna). Only 52% in the S&P 500 have beaten expectations, despite the record number of warnings.
- Michigan sentiment disappointed. I place more emphasis on this than most, and I especially like the Doug Short chart, shown and analyzed in his regular update.
- High frequency indicators are turning cold. See the full report from New Deal Democrat (writing at xe.com). Consumer spending is probably the most disturbing on the list.
- Rail traffic is weaker (See GEI for charts and analysis).
The Ugly
Shaky fingers on the nuclear trigger. Drug problems and cheating among those charged with firing ICBM's? It has a scary feel to it, but some wonder if this system is still even necessary. Gwen Ifill has a typically fine interview with three authoritative sources.
The Silver Bullet
I occasionally give the Silver Bullet award to someone who takes up an unpopular or thankless cause, doing the real work to demonstrate the facts. Think of The Lone Ranger. Reader nominations are always appreciated!
This week's award goes to Bespoke Investment Group for digging deeper into one of those appealing and persuasive charts from last week. The idea is that big Wall Street movies signal market tops. Many accepted this uncritically because it fits the current theme and is difficult to verify.
As so often happens, the original source played fast and loose with the timing. Here is the Bespoke analysis, showing a dramatically different result.
Noteworthy
The sloppy correlation/causation is a continuing trap for the unwary. A regular reader noted that the favorites in this week's NFL playoffs were from the two states that most recently legalized marijuana!


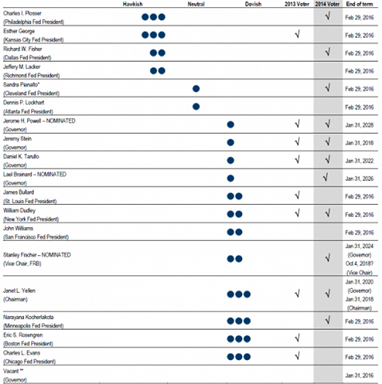
Fed Watching
Those who ignore my advice about Fed obsession should at least have a good scorecard for the players. There have been several recent changes. When you get fresh news, you need to know the leanings of the source as well as whether he/she is a voting member. Cardiff Garcia helps you score from home with this chart. See the full article for explanation and analysis.
Quant Corner
Whether a trader or an investor, you need to understand risk. I monitor many quantitative reports and highlight the best methods in this weekly update. For more information on each source, check here.

Recent Expert Commentary on the Economy
Barry Ritholtz: This is an oldie but goodie from last October. I cite it now because of the continuing lame excuses by those who have been on the wrong side of their market forecasts. They all blame it on the Fed, as if that were not part of the mission in thinking about the economy and markets. This week's Barron's is the most recent case in point. Barry patiently explains the distinction between correlation and causation, showing how various fundamental factors have improved along with stocks. It is important to read the entire post, but here is a key quote:
There are a variety of reasons why I am unwilling to attribute the 100% suggestion. The first and most obvious is that markets are extremely complex, with all manner of psychological, valuation, trend as well as monetary inputs. The intricacy of equities is such that there is almost never any one single factor that causes major market moves in either directions. Invariably, there are a myriad factors that establish conditions, impact traders, affect how people interact that are the prime causes.
If you are willing to say the Fed is the cause of 100% of market gains, you are simultaneously implying that every other factor had a net zero impact. I simply don't buy that.
See also my own Fed as a Fig Leaf.
Doug Short: The regular update of the "Big Four" indicators used by the NBER to identify recessions. There are two updates since I ran the chart last week, so take a look.
Doug also updates his ongoing commentary about the ECRI recession call, repeated again last week. This post explains why the most recent ECRI employment comparisons are not valid – "apples to oranges." This is great analysis and commentary, requiring more attention than we can give it in the weekly update.
Georg Vrba: Takes a look at potential stock returns through 2020, using the 5-year Shiller CAPE. He has also updated his market timing method, which still calls for a leveraged investment in stocks.
RecessionAlert: Sees improvement in leading indicators for US growth, while highlighting danger areas worth monitoring. See the article for detailed charts on each indicator.
The Week Ahead
This is a very minor week for news and data.
The "A List" includes the following:
- Initial jobless claims (Th). Best fresh data on employment, more important than ever after last month's employment report.
- Leading indicators (Th). Some controversy in the background, but still widely followed.
- Existing home sales (Th). Perhaps less relevant than new construction for the economy, but strongly related.
The "B List" includes:
- FAFHA housing prices (Th). Good data, but only on qualifying loans. A different universe from Case/Shiller.
Mostly, the market will focus on earnings.
How to Use the Weekly Data Updates
In the WTWA series I try to share what I am thinking as I prepare for the coming week. I write each post as if I were speaking directly to one of my clients. Each client is different, so I have five different programs ranging from very conservative bond ladders to very aggressive trading programs. It is not a "one size fits all" approach.
To get the maximum benefit from my updates you need to have a self-assessment of your objectives. Are you most interested in preserving wealth? Or like most of us, do you still need to create wealth? How much risk is right for your temperament and circumstances?
My weekly insights often suggest a different course of action depending upon your objectives and time frames. They also accurately describe what I am doing in the programs I manage.
Insight for Traders
Felix has shifted to slightly bullish. Even over the last few "neutral" weeks we have been fully invested in the top three sectors. Felix's ratings have been in a fairly narrow range for several months. The rapid news-driven shifts are not the ideal conditions for Felix's three-week horizon. The ratings are slightly more positive, but many sectors are still in the penalty box.
Insight for Investors
I review the themes here each week and refresh when needed. For investors, as we would expect, the key ideas may stay on the list longer than the updates for traders. This is the "actionable investment advice" summarized here.
The best advice about possible market tops comes from three favorite sources:
- Abnormal Returns draws upon several sources to illustrate how the average investor underperforms a simple index. The post is full of good advice and great links. The key? Owning a good index with low costs is no solution for the temptations of human nature.
- Eddy Elfenbein recommends viewing your investments as a bottoms-up process.
My advice to investors is to grant yourself a healthy distance from those who view investing from 30,000 feet. It's easy to wave your hand and say everything's overpriced and the Dow could go to 1,000. Instead, if you're interested in a company, start at the ground level and found out why it's successful.
Josh Brown explains why it is wrong to think of "new all-time highs" as scary. This is a great post, combining a practical knowledge of odds with Josh's insight into investor psychology. Here is a taste:
It means that no one has a loss in the stock or is "waiting to get back to even so they can sell".
It means that a host of people who had been waiting for that pullback to get in are now ripping their own skin off in aggravation.
It means that it is the new favorite stock of those who are long, one that they will not easily part with because it is now "one of their winners" and it "has been good to them".
It means the people who "bought small" are pissed even though they are up, these are the people sitting just below the offer like Tick Tock the crocodile loitering below Captain Hook's gangplank – just waiting for a bite.
…and much more.
This week I also published my regular annual preview interview with Seeking Alpha. It combines strategy, perspective, and some specific themes. As I often do, I start by emphasizing risk control. I see that as crucial in dealing with the temptations to engage in poor market timing.
Many investors remain cautious about stocks and want to emphasize income. At the request of several readers I wrote up an example of an actual trade, illustrating how you can improve your yield from the stodgier stocks. It does not require a rising market, and provides an extra measure of safety. You can try this at home!
While I am not trying to time a correction, I do have more than a normal cash level, raised through normal trimming. I am actively shopping in the sectors I have highlighted.
And finally, we have collected some of our recent recommendations in a new investor resource page -- a starting point for the long-term investor. (Comments and suggestions welcome. I am trying to be helpful and I love feedback).
Final Thought
In my weekly updates I try to avoid the valuation debate, which always seems to arouse irrational passions. It is difficult to avoid this week since the overvalued/bubble meme is getting such a big play. Here is a key quotation from a popular source:
As the valid measures of the US market show that it is currently around 40% overvalued, some ingenuity is needed to claim otherwise.
The quotation is from Andrew Smithers in October, 2009. (I owe someone a hat tip on this reference, but I lost the link).
I understand that circumstances change, models fail, and mistakes can be made. If you are serious about your investing, you will learn, improve, and move on. If your business model does not depend upon accurate results, you are free to indulge in stubbornness rather than ingenuity!